process-exporter-dashboard 1,7541,754
10/24/2024
6/5/2025
2
>=10.0.3
Prometheus
Dashboard for monitoring Linux processes.
Prometheus, Process-exporter and Node-exporter are used to operate the dashboard.
Detailed information on GitHub.
The dashboard contains:
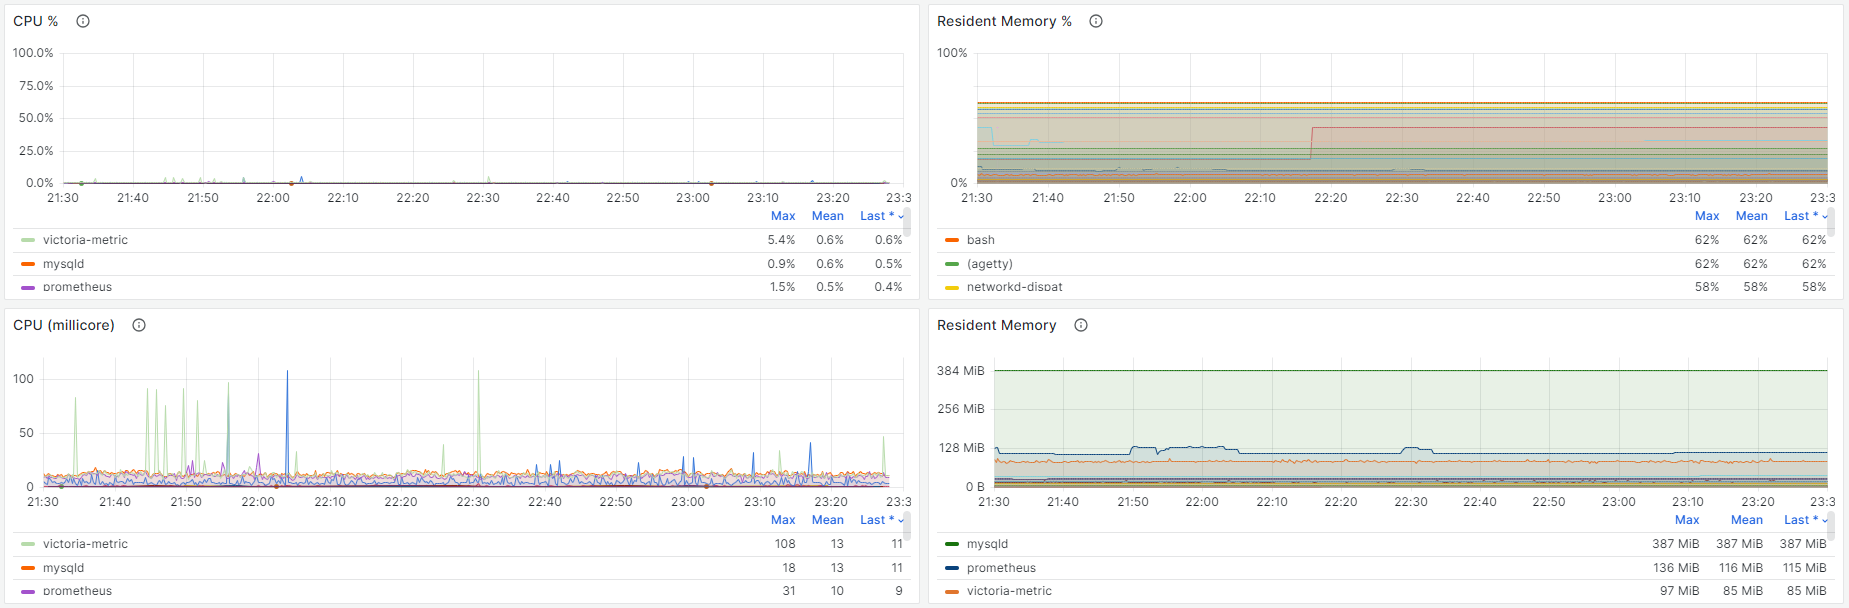
- CPU % / CPU (millicore) - CPU utilization by the process.
- Resident Memory % / Resident Memory - the actual memory usage of the process.
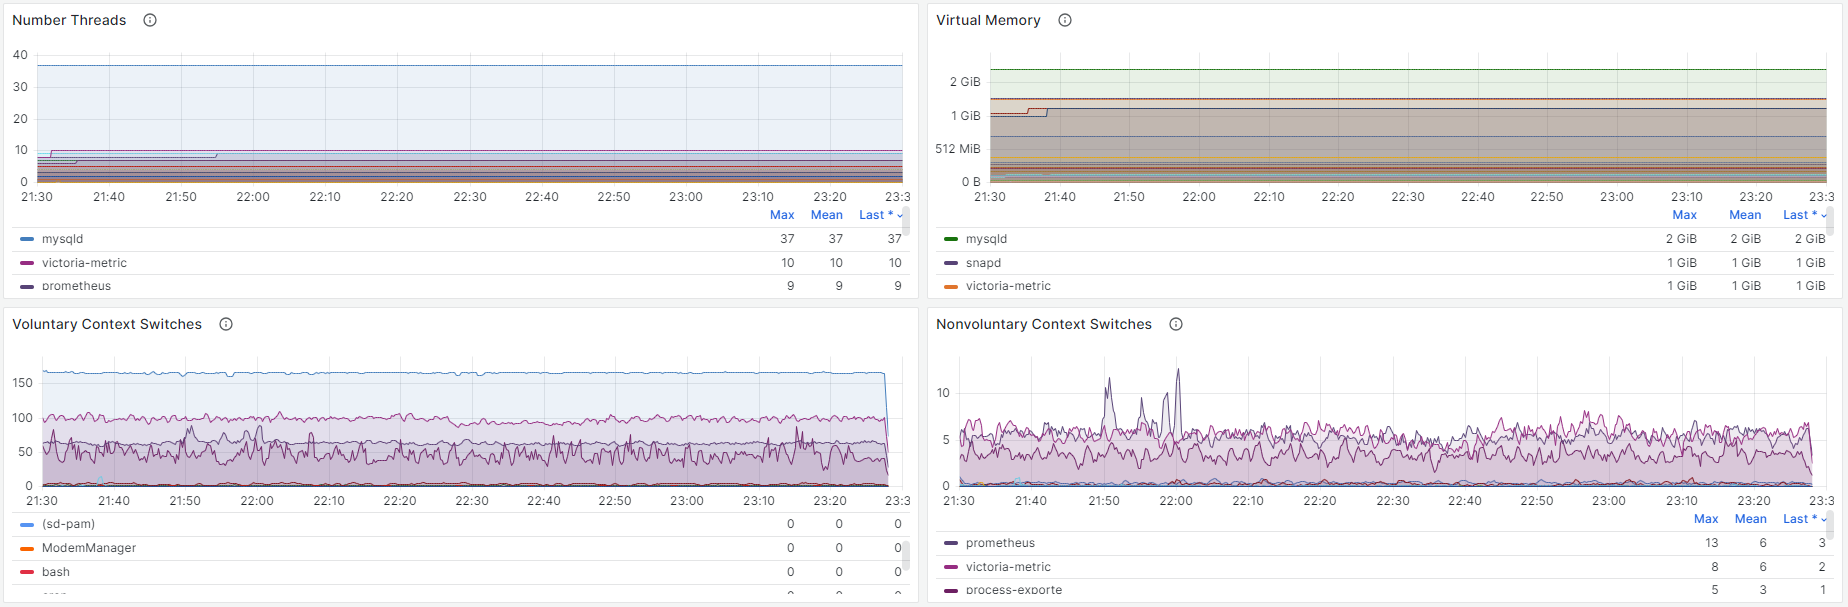
- Virtual Memory - the total amount of memory that a process may need.
- Number Threads - the number of threads.
- Voluntary Context Switches - voluntary context switching.
- Nonvolunary Context Switches - involuntary context switching.
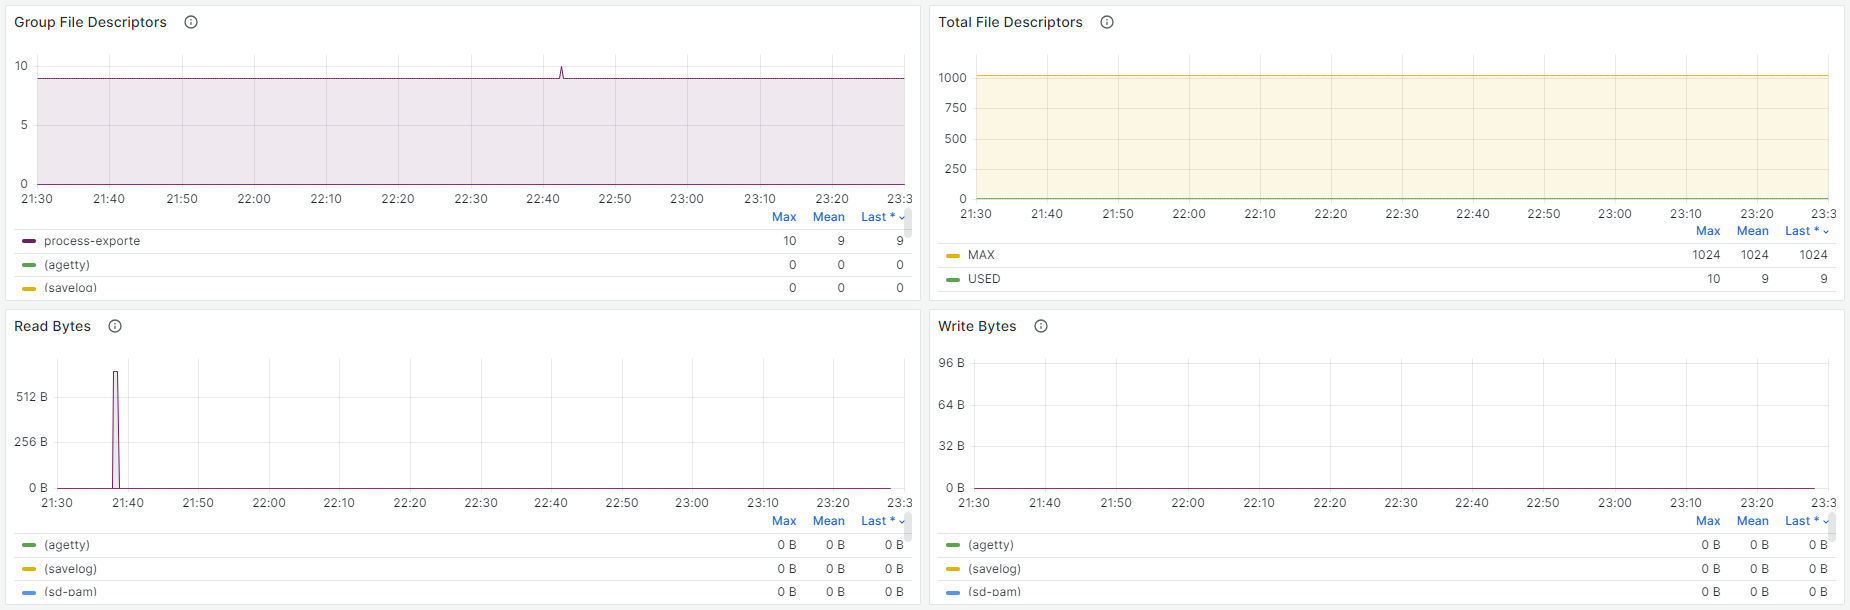
- Group File Descriptors - the number of open file descriptors for the group.
- Total File Descriptors - the number of open file descriptors / the maximum number of open file descriptors.
- Read Bytes - the number of bytes read by the group.
- Write Bytes - the number of bytes written by the group.
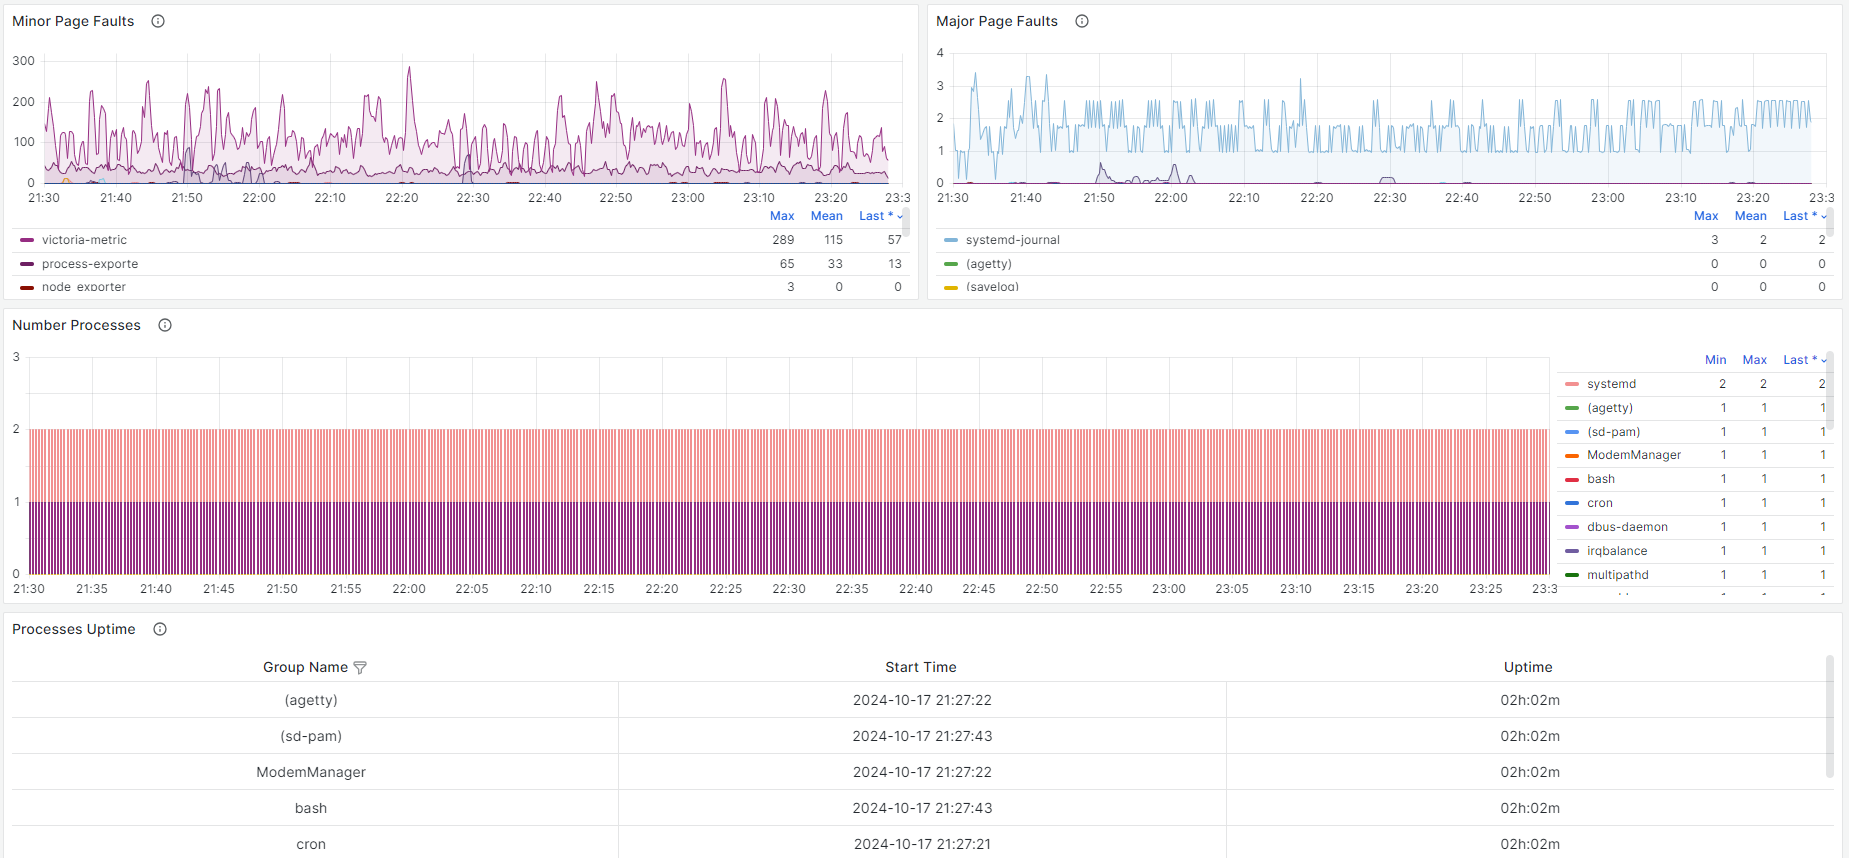
- Minor Page Faults - minor memory page errors.
- Major Page Faults - the main errors of the memory page.
- Number Processes - the number of processes in the group.
Export Dashboard✕
Download
Copy to Clipboard
Used Metrics 1414
namedprocess_namegroup_cpu_seconds_total
-
node_cpu_seconds_total
namedprocess_namegroup_memory_bytes
namedprocess_namegroup_num_procs
namedprocess_namegroup_num_threads
namedprocess_namegroup_context_switches_total
namedprocess_namegroup_open_filedesc
-
process_open_fds
-
process_max_fds
namedprocess_namegroup_read_bytes_total
namedprocess_namegroup_write_bytes_total
namedprocess_namegroup_minor_page_faults_total
namedprocess_namegroup_major_page_faults_total
namedprocess_namegroup_oldest_start_time_seconds