Node Information 1,0861,086
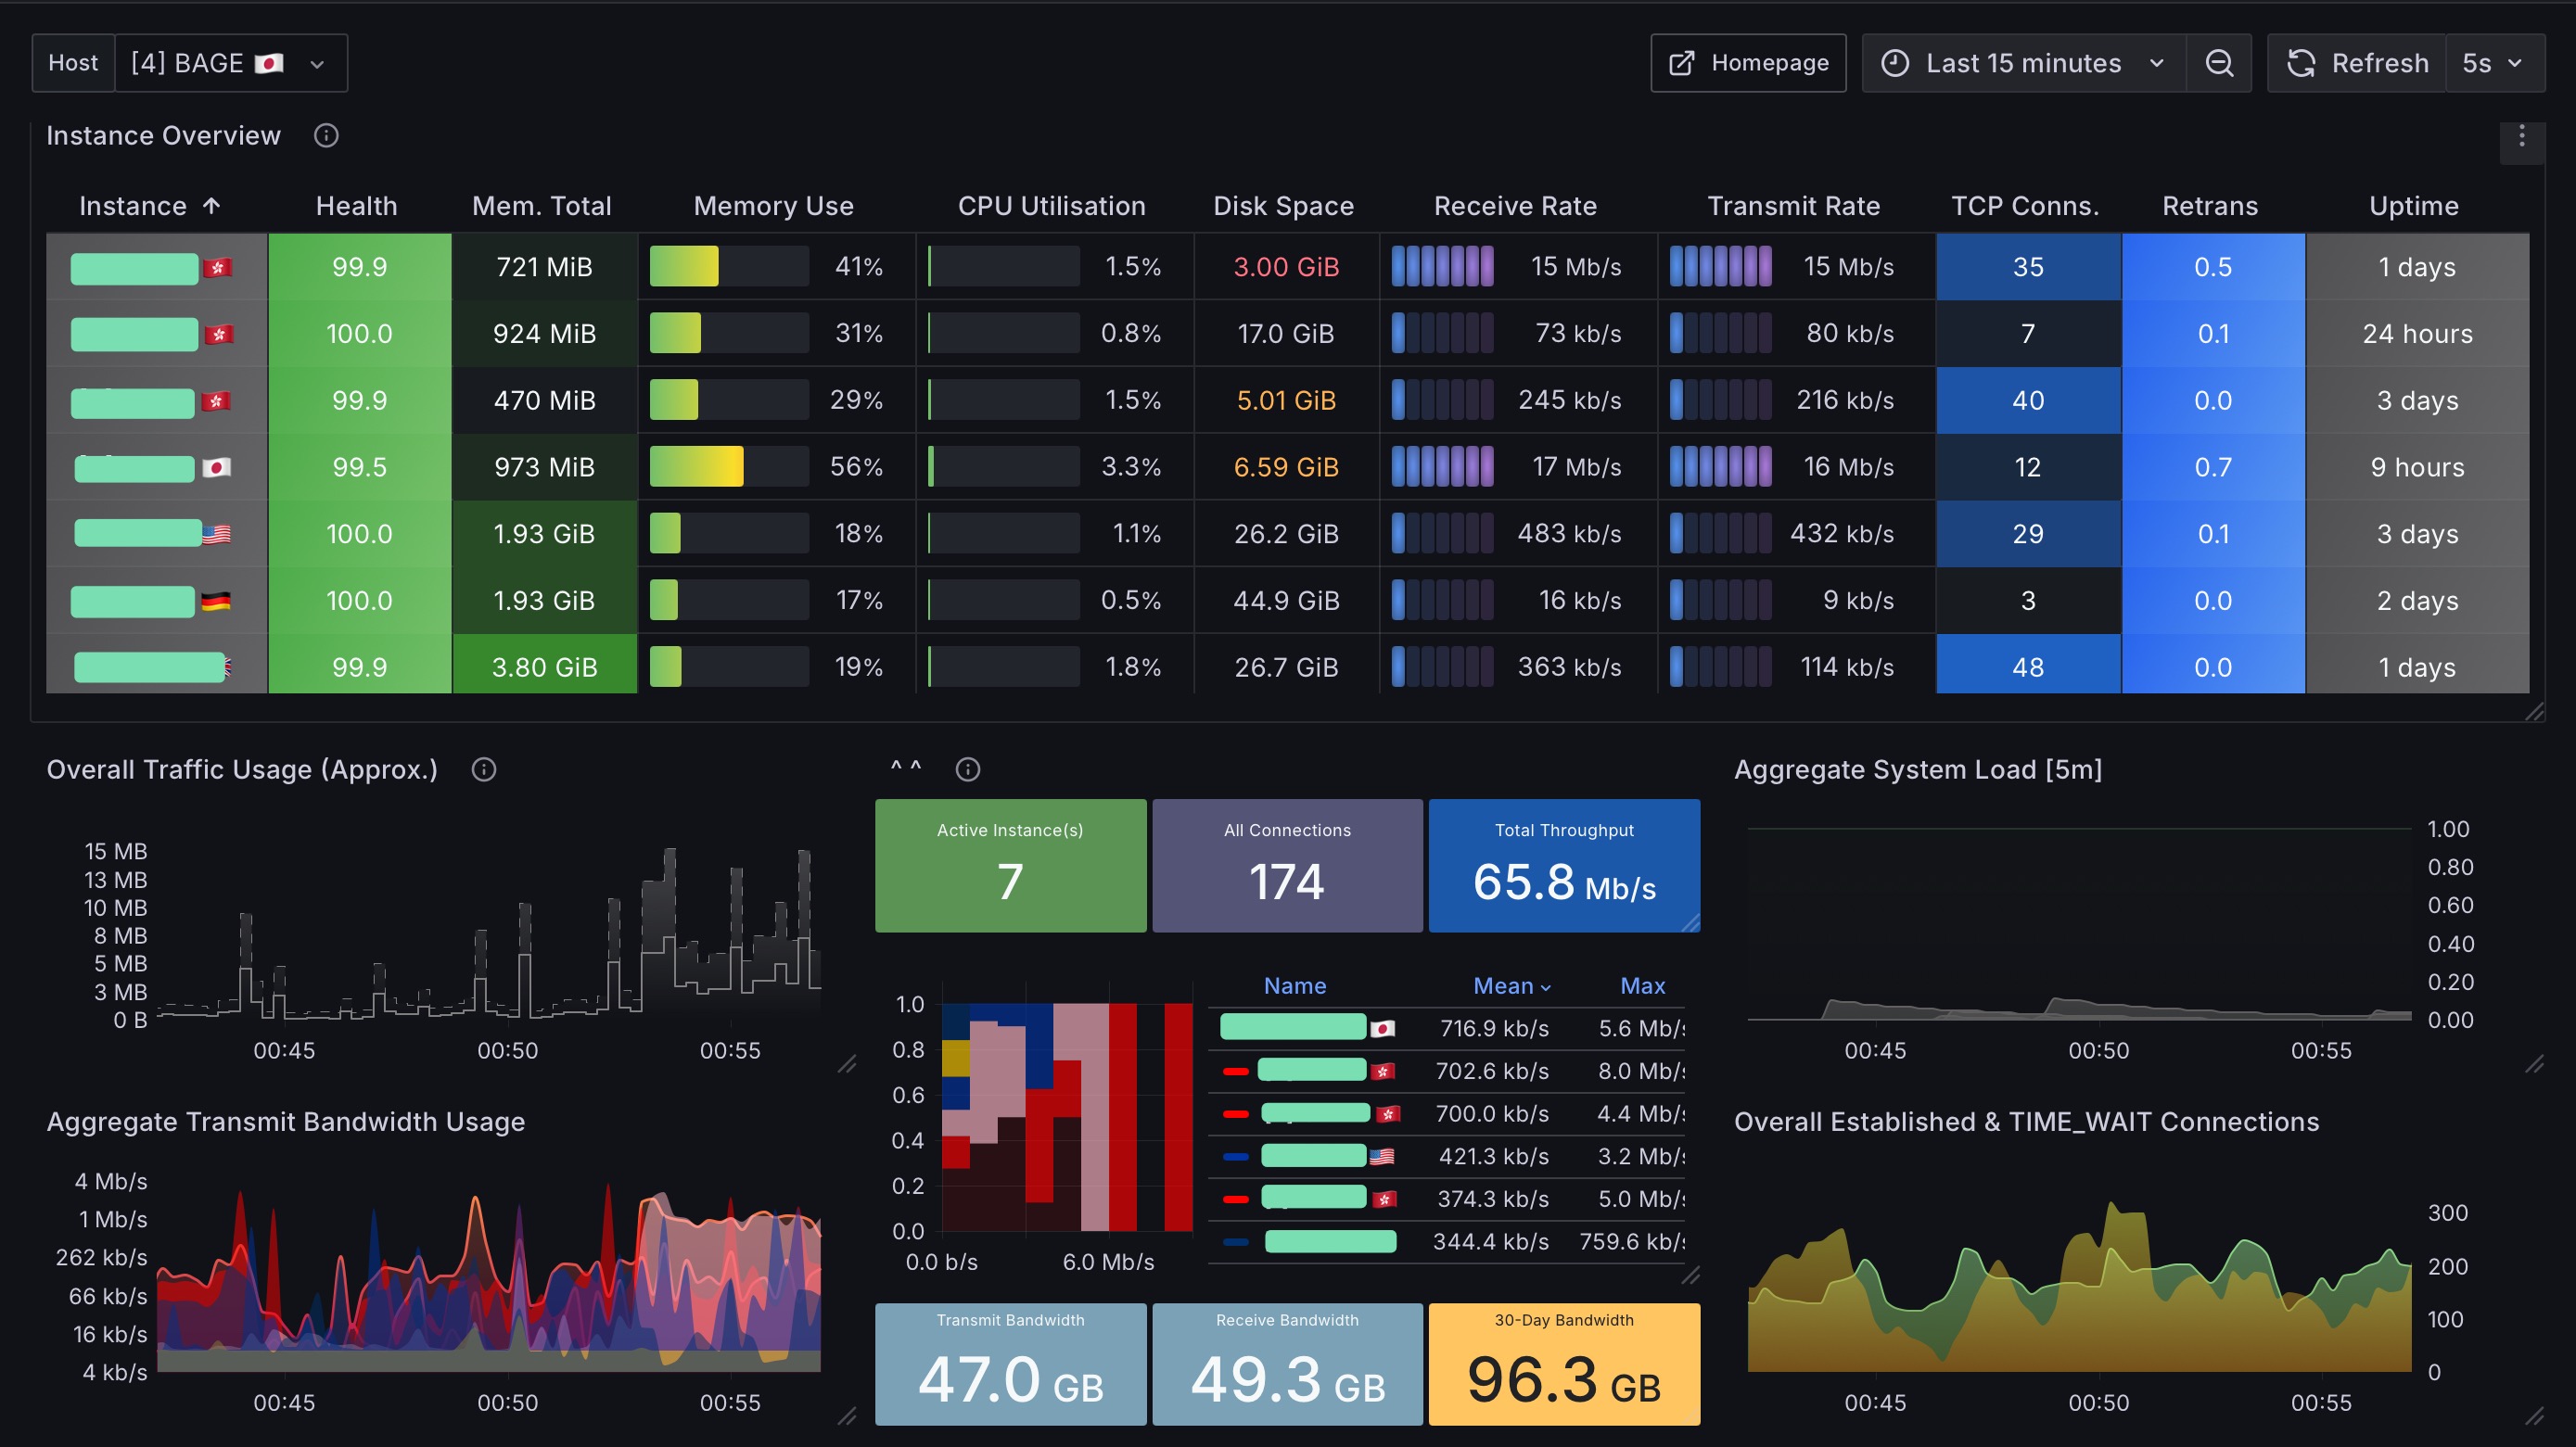
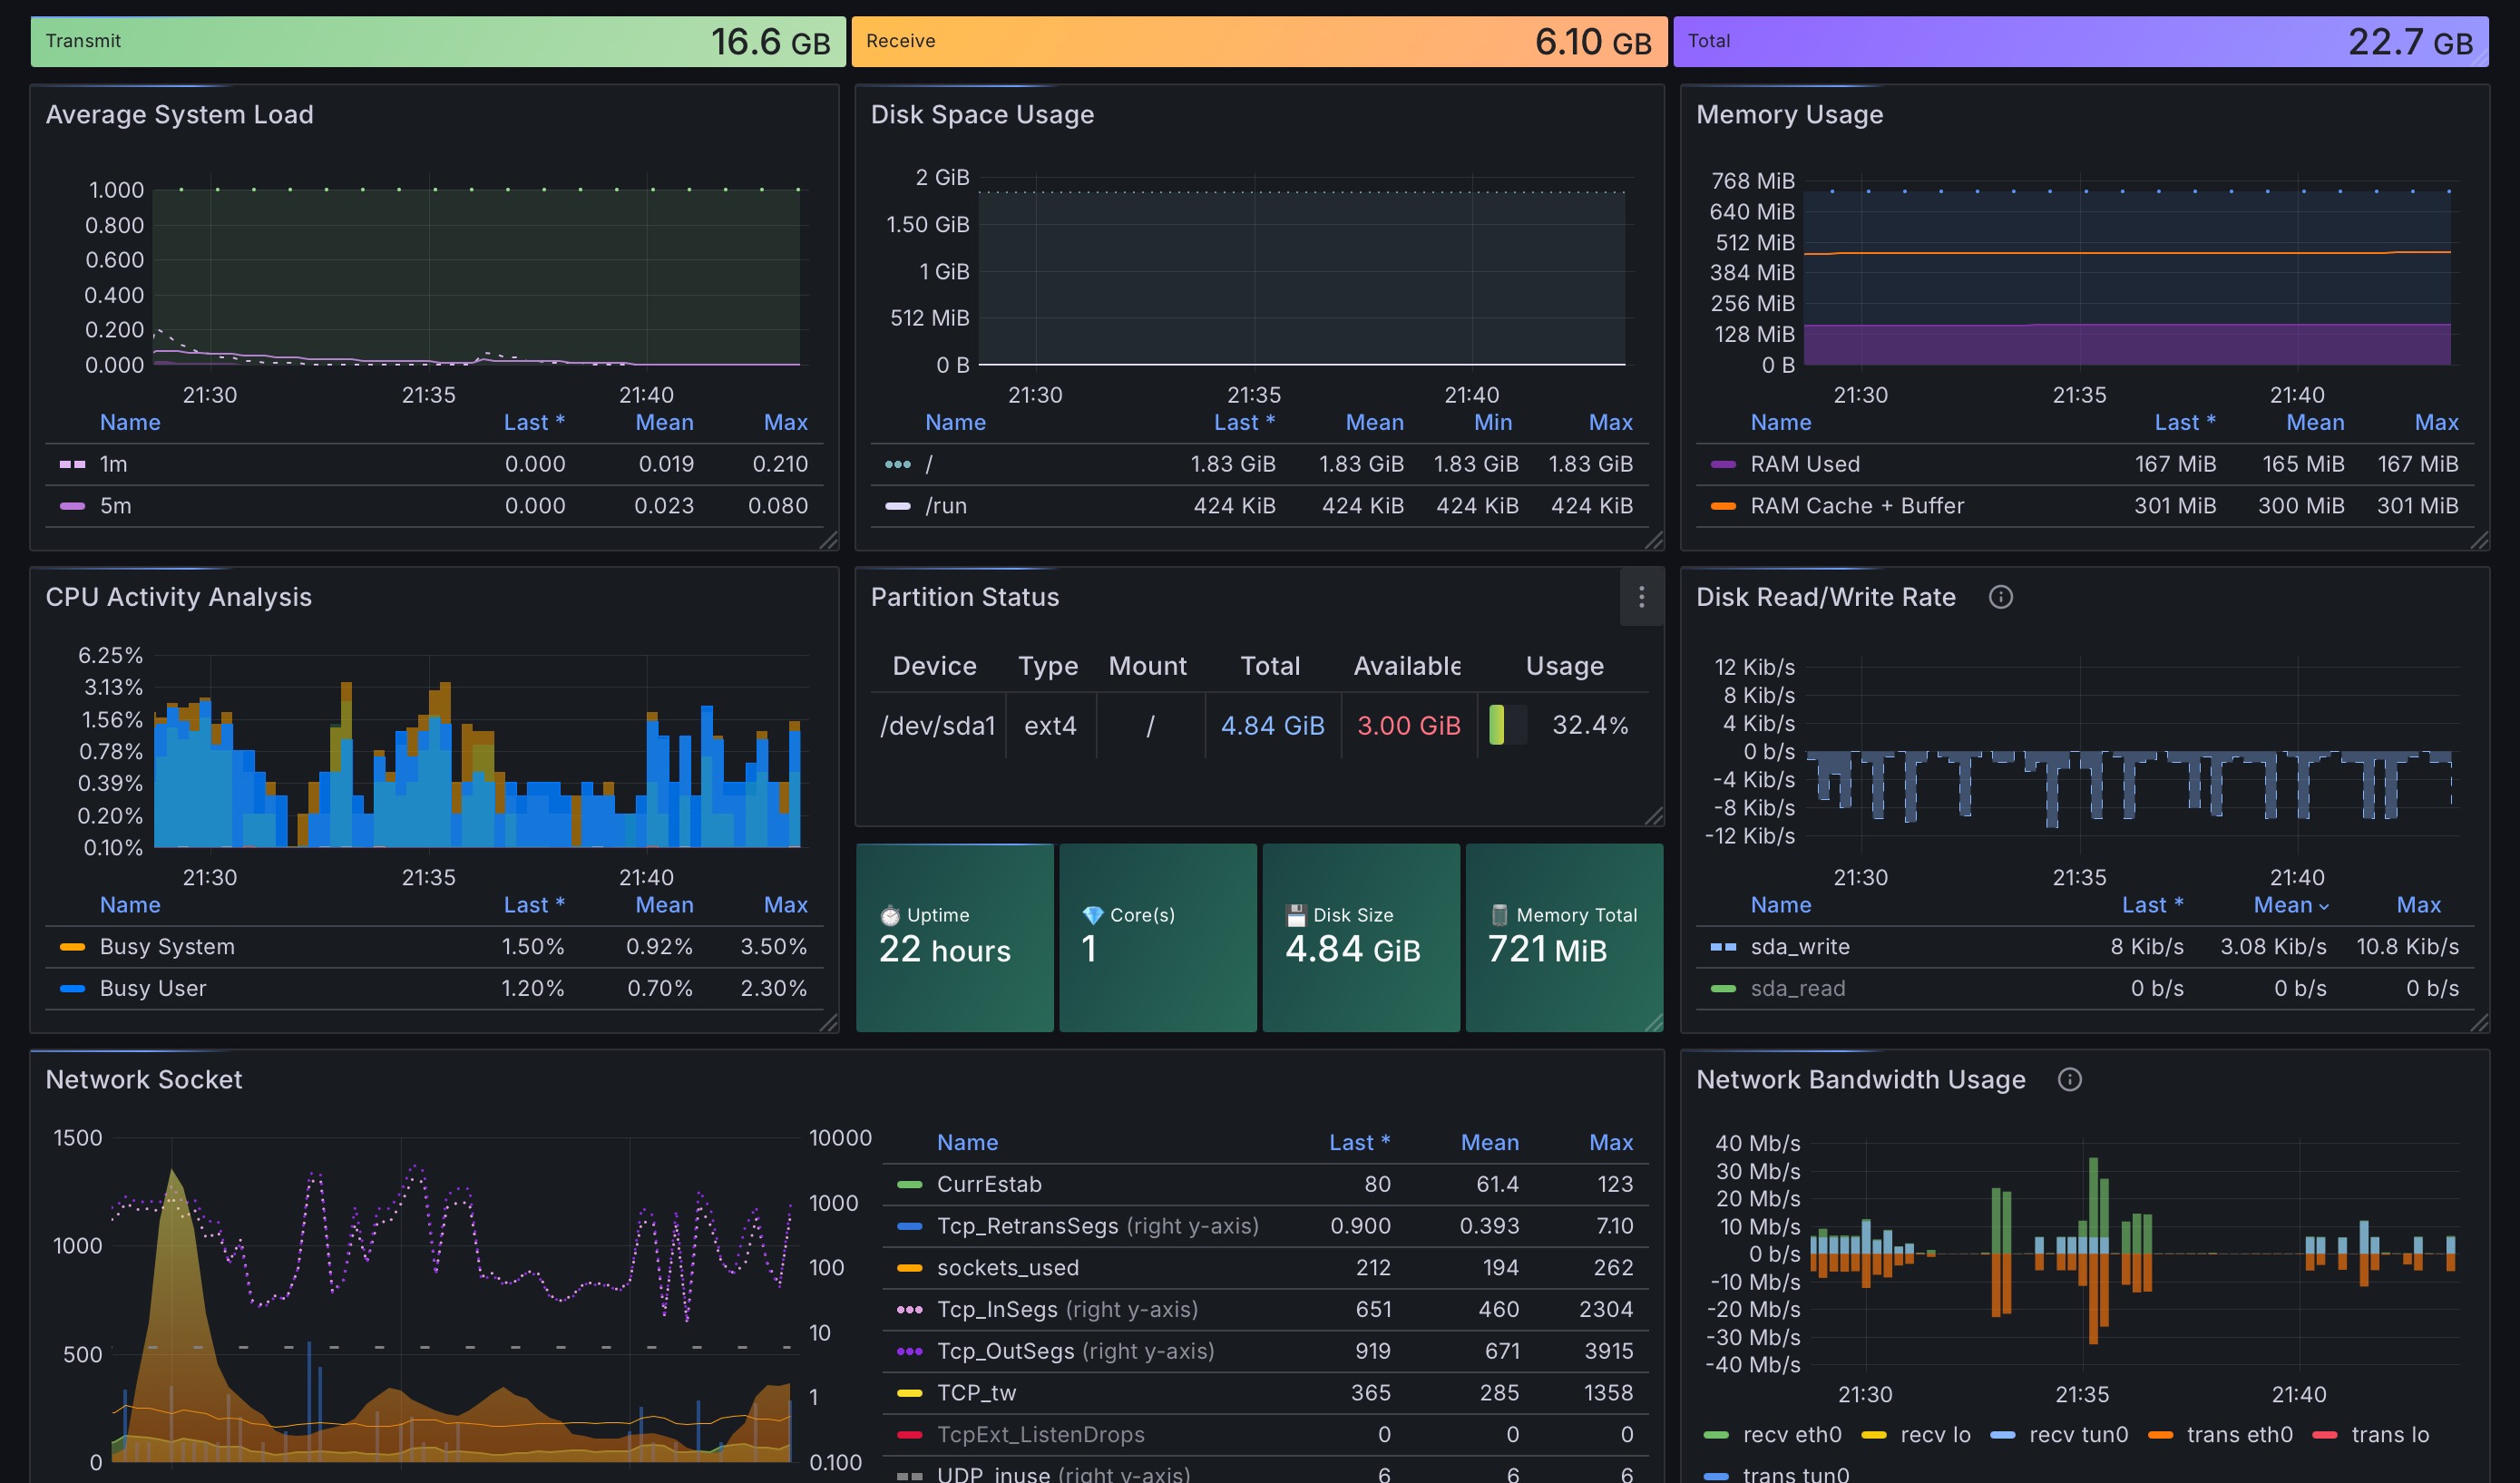
This dashboard is built on Node Exporter Full with a re-design, including basic network, CPU, memory and disk information. Perfect for casual users or Grafana/Prometheus/nodeExporter beginners.
Used Metrics 3030
-
node_cpu_seconds_total
-
node_memory_MemAvailable_bytes
-
node_memory_MemTotal_bytes
-
node_disk_io_time_seconds_total
-
node_filesystem_avail_bytes
-
node_network_transmit_bytes_total
-
node_network_receive_bytes_total
-
node_netstat_Tcp_CurrEstab
-
node_netstat_Tcp_RetransSegs
-
node_boot_time_seconds
-
up
-
node_load5
-
node_sockstat_TCP_tw
-
node_load1
-
node_load15
-
node_filesystem_size_bytes
-
node_memory_MemFree_bytes
-
node_memory_Cached_bytes
-
node_memory_Buffers_bytes
-
node_memory_SReclaimable_bytes
-
node_memory_SwapTotal_bytes
-
node_memory_SwapFree_bytes
-
node_filesystem_free_bytes
-
node_disk_read_bytes_total
-
node_disk_written_bytes_total
-
node_sockstat_sockets_used
-
node_netstat_Tcp_InSegs
-
node_netstat_Tcp_OutSegs
-
node_netstat_TcpExt_ListenDrops
-
node_sockstat_UDP_inuse