Kubernetes Dashboard 5,7215,721
Overview
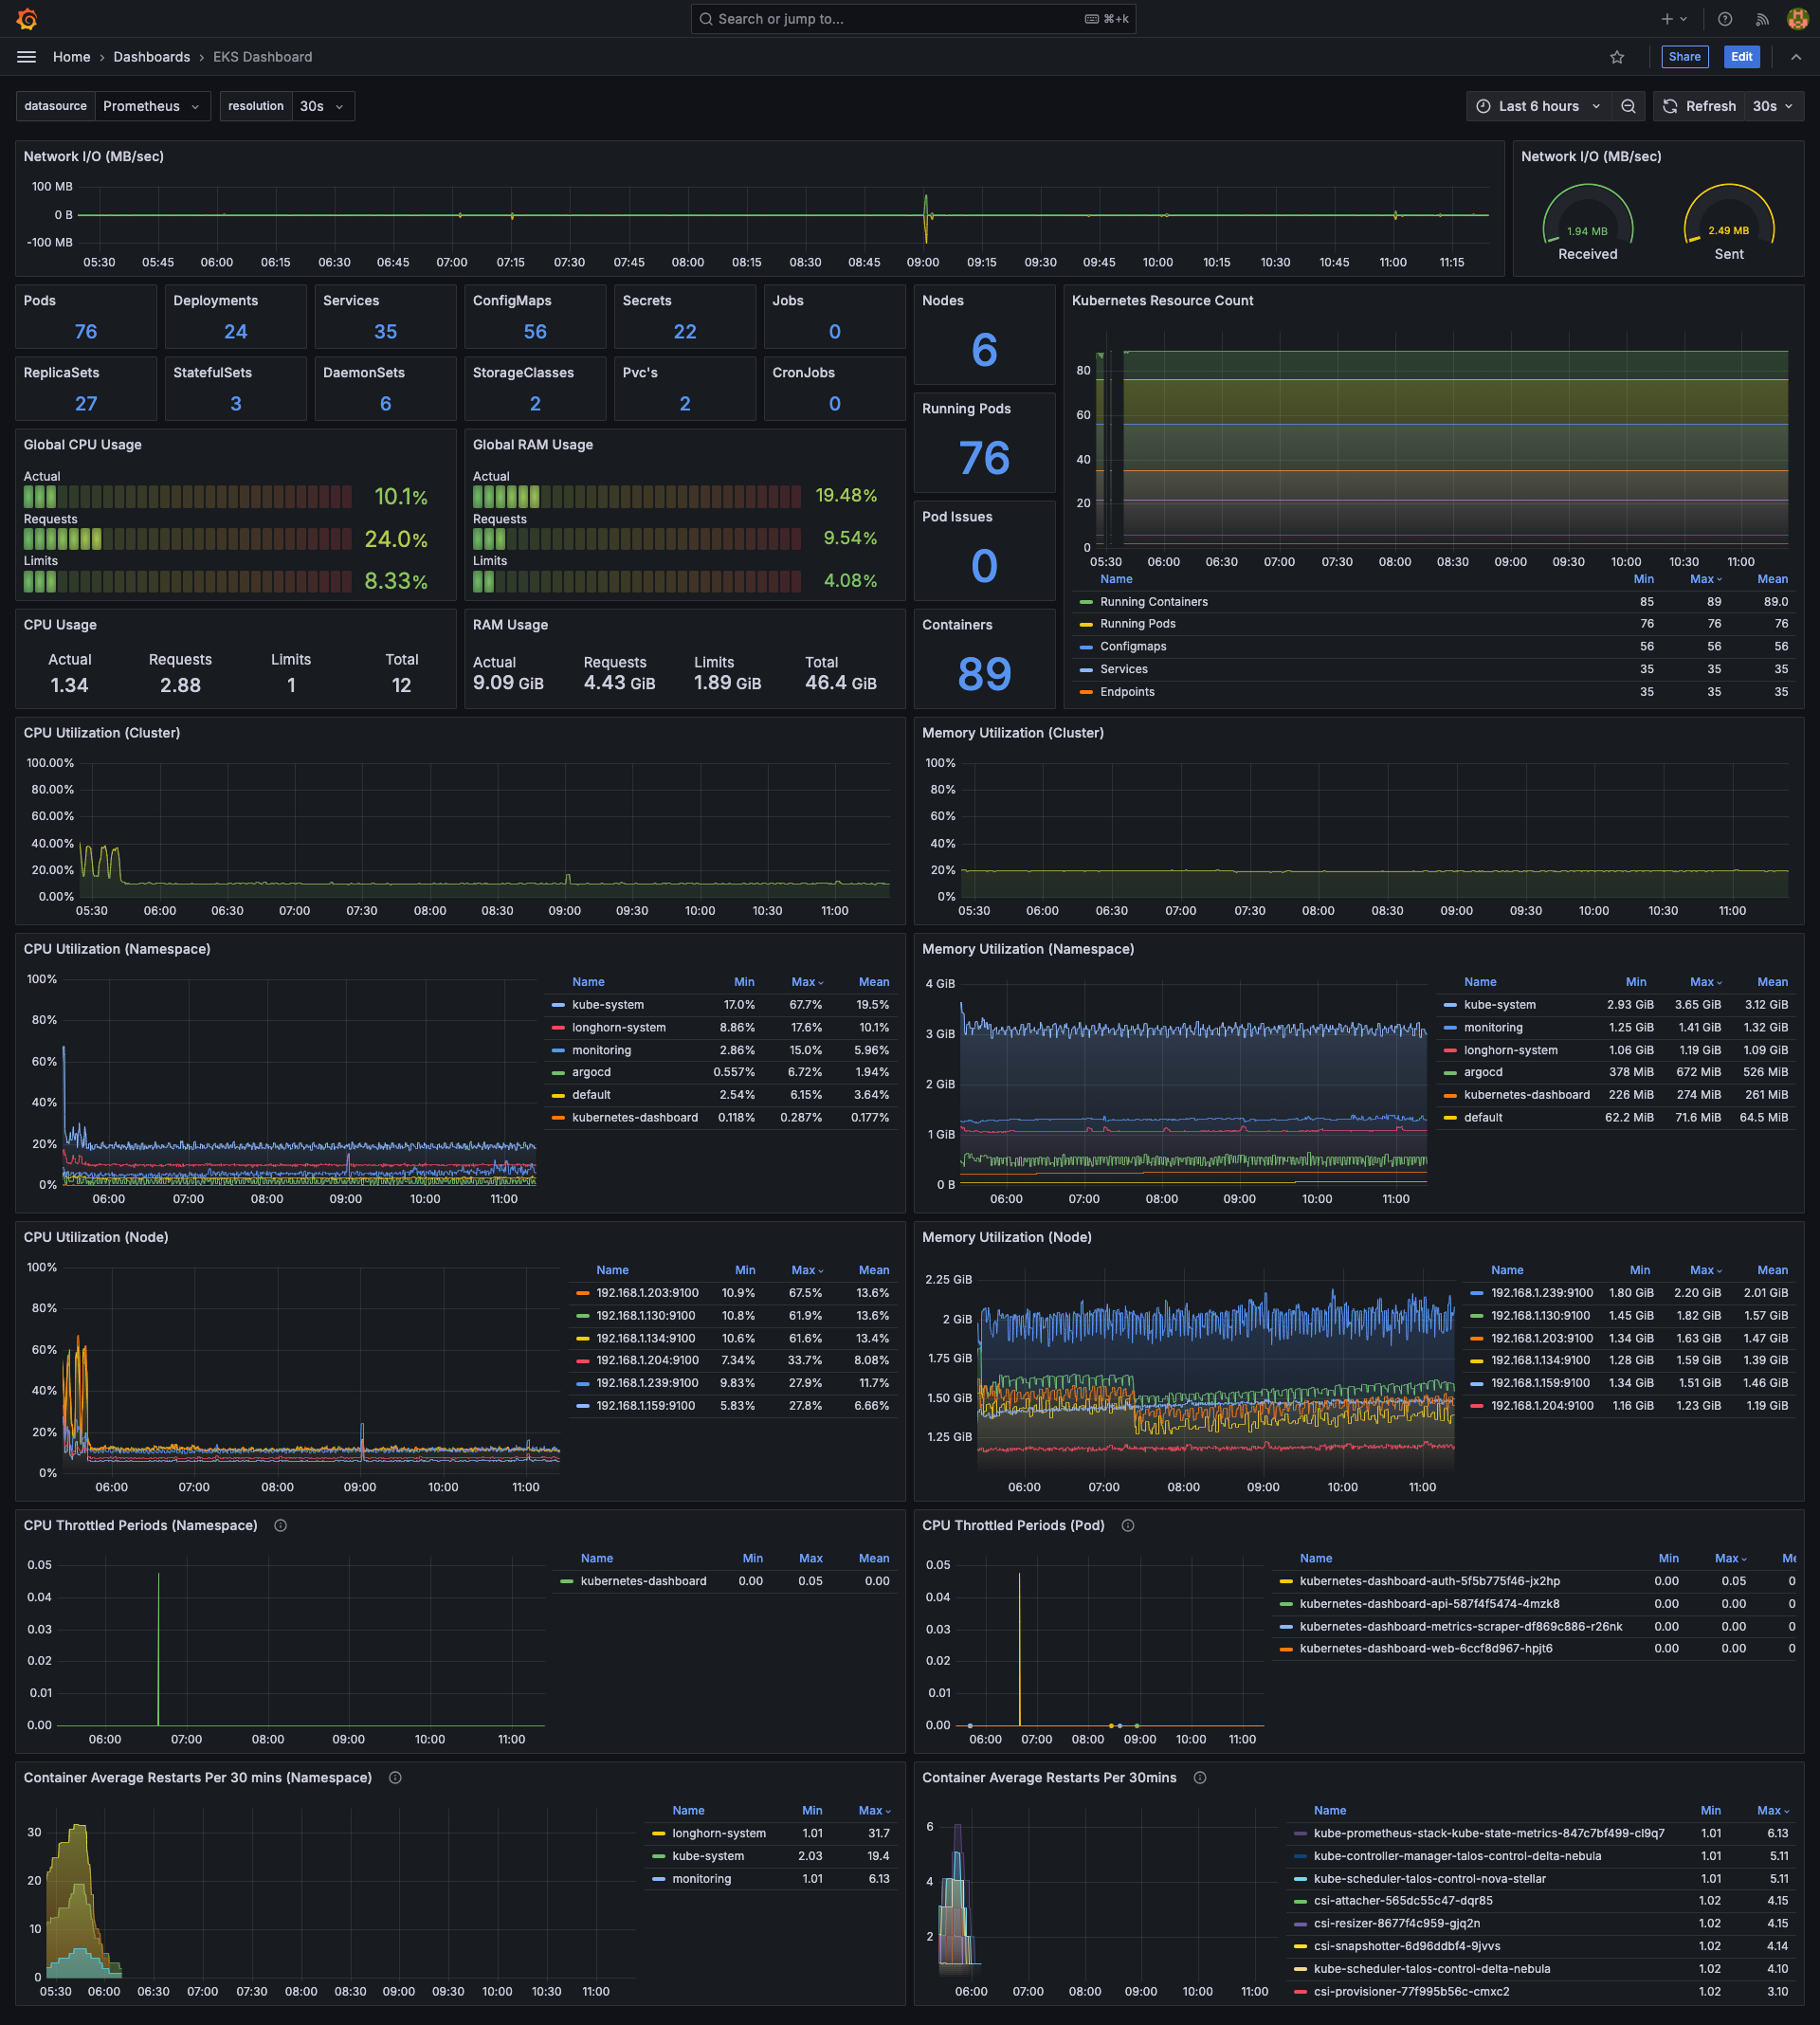
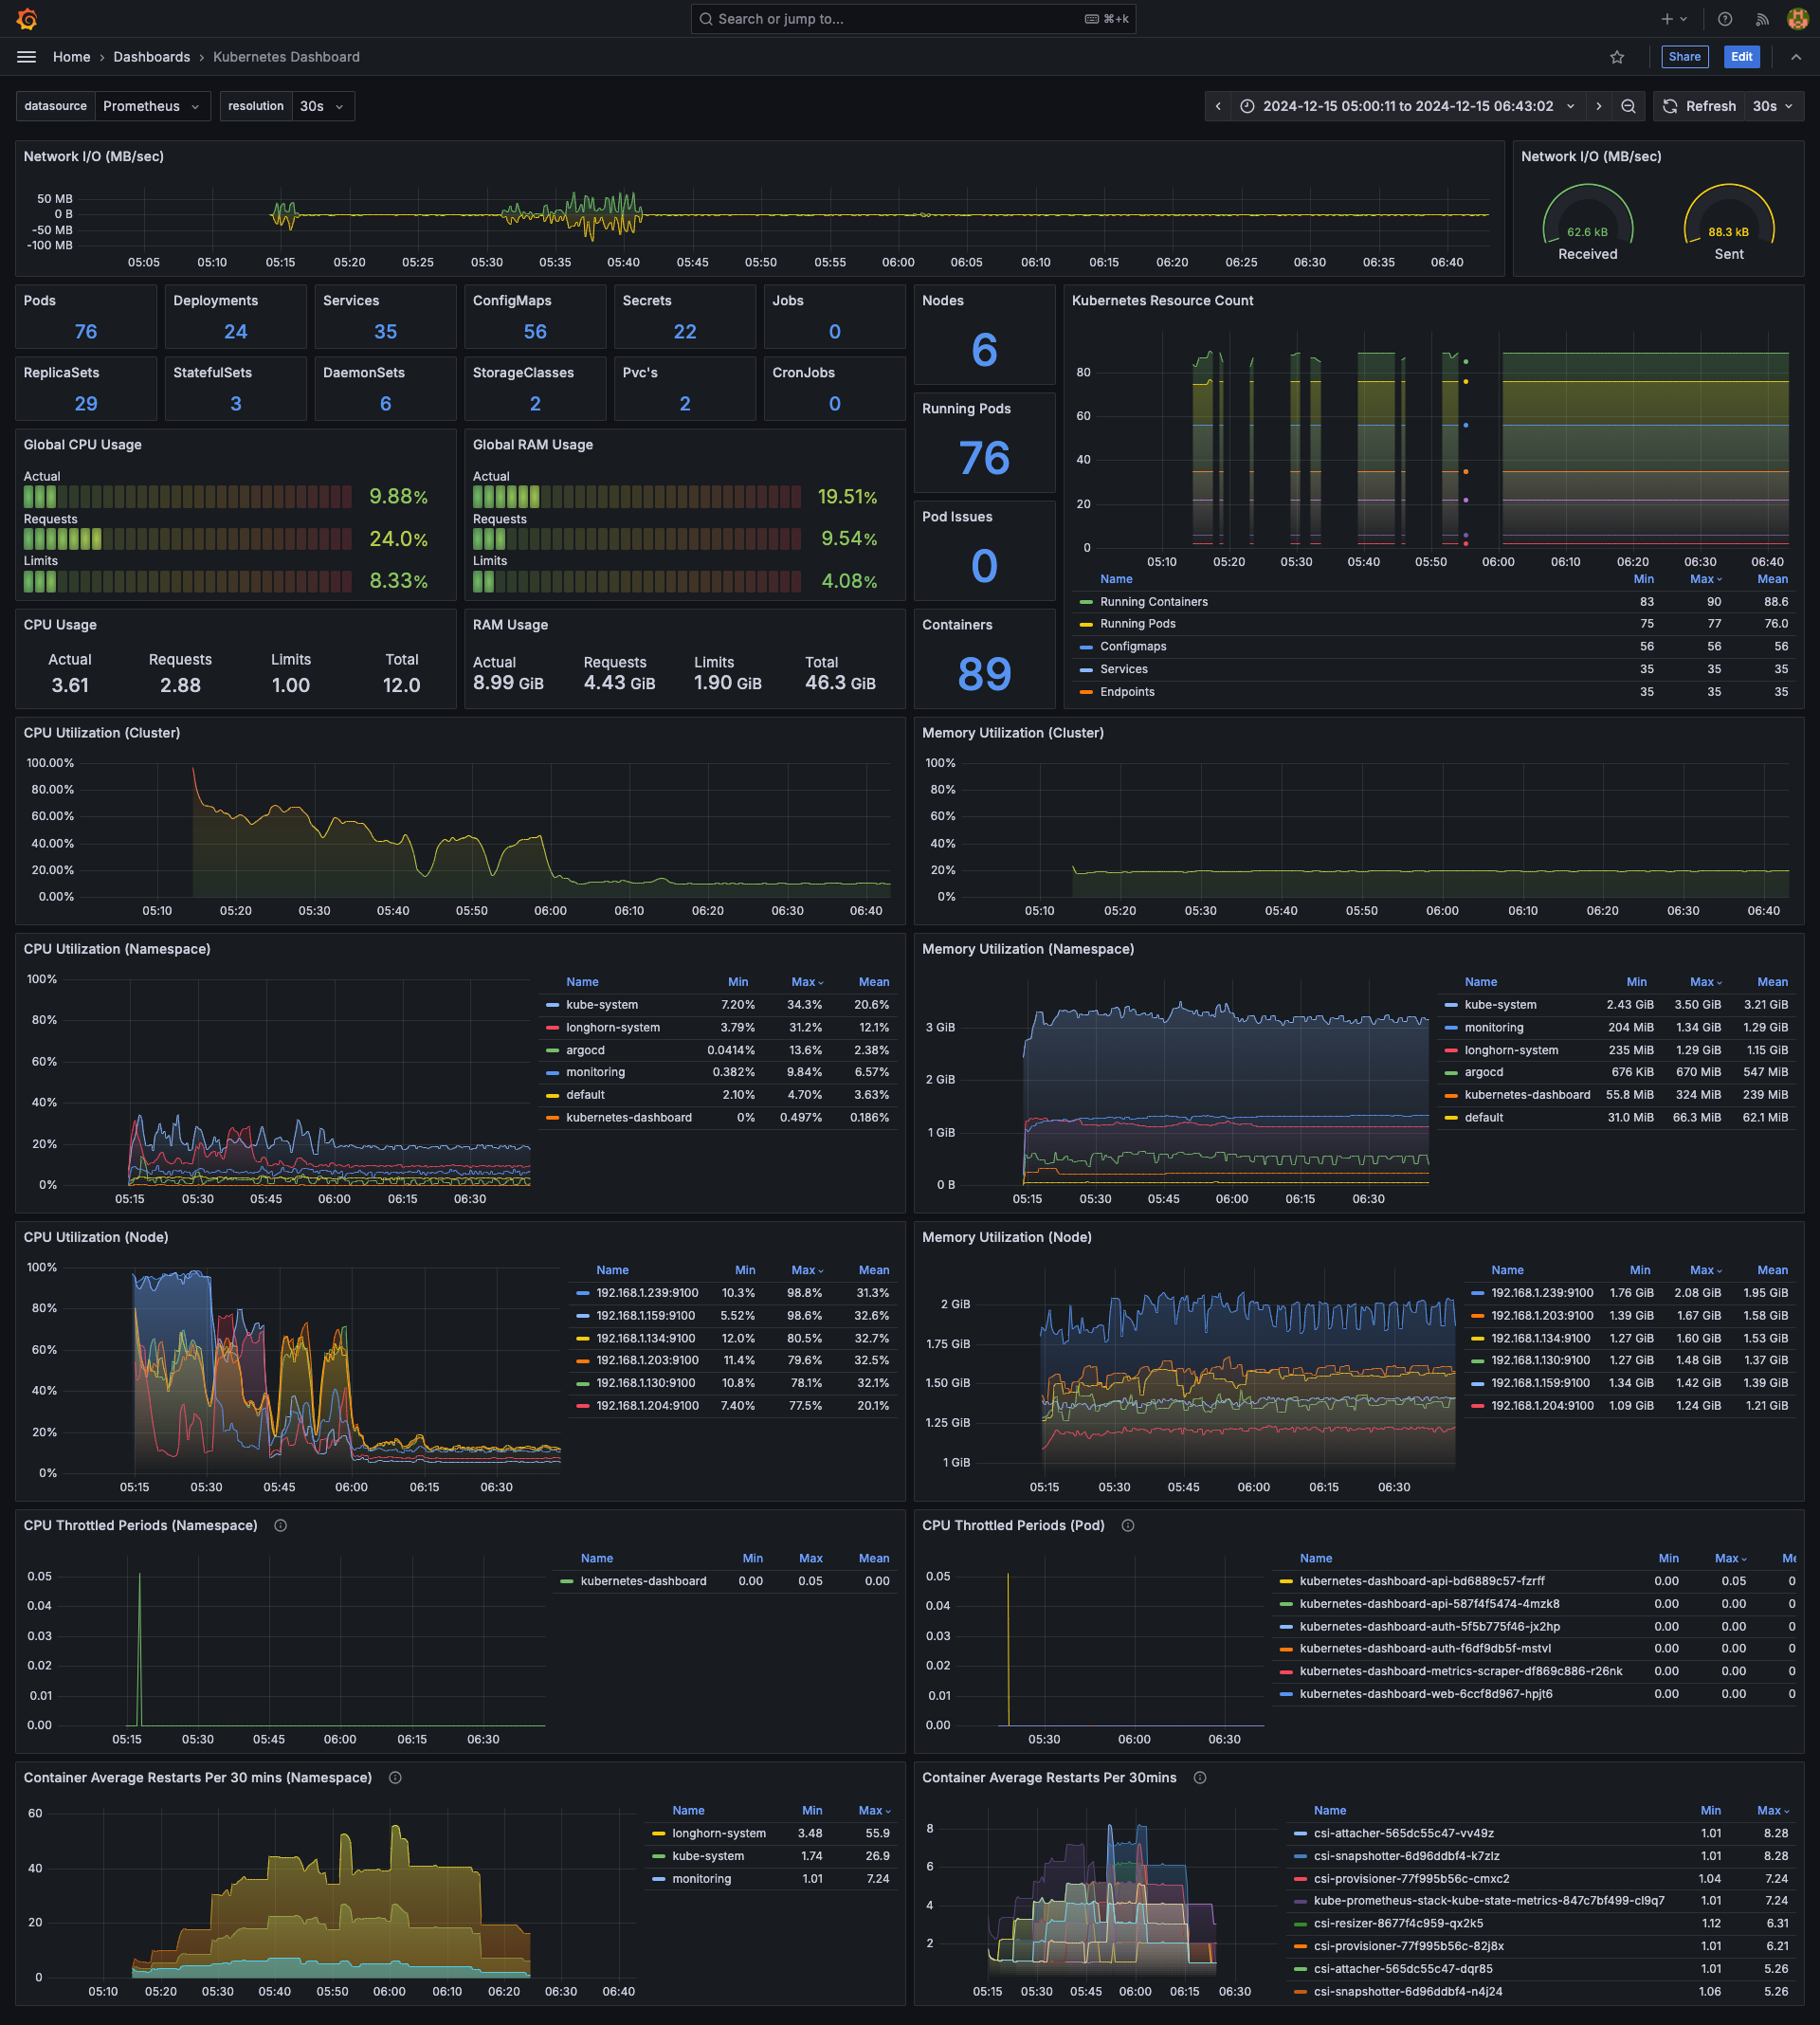
High-level view of Kubernetes cluster - useful for monitoring, alerting and troubleshooting.
Works on local, bare-metal or cloud provided clusters (e.g. k3s, kind, minikube, Talos Linux, EKS etc..)
github.com/adegoodyer/grafana-dashboards
Features
- network I/O
- k8s resource counts
- highlights pods not running
- CPU/RAM utilization (cluster, node, namespace and pod)
- CPU throttling information (namespace/pod)
- container restart information (namespace/pod)
Dependencies
Last tested via kube-prometheus-stack Helm chart v66.3.1
However, will work when recent versions of the following Prometheus exporters are installed..
cAdvisorkube-state-metricsnode-exporter
Contributing
- Fork the repository
- Create your feature branch (
git checkout -b feature/amazing-feature) - Commit your changes (
git commit -m 'Add some amazing feature') - Push to the branch (
git push origin feature/amazing-feature) - Open a Pull Request
License
This project is licensed under the MIT License - see the LICENSE file for details.
Support
Used Metrics 4040
-
container_network_receive_bytes_total
-
container_network_transmit_bytes_total
kube_pod_created
kube_deployment_created
kube_service_created
kube_configmap_created
kube_secret_created
kube_job_created
kube_node_info
kube_namespace_labels
kube_pod_container_status_running
kube_pod_status_phase
kube_service_info
kube_endpoint_info
kube_ingress_info
kube_deployment_labels
kube_statefulset_labels
kube_daemonset_labels
kube_persistentvolumeclaim_info
kube_hpa_labels
kube_configmap_info
kube_secret_info
kube_networkpolicy_labels
kube_replicaset_created
kube_statefulset_created
kube_daemonset_created
kube_storageclass_created
kube_persistentvolume_created
kube_cronjob_created
-
node_cpu_seconds_total
kube_pod_container_resource_requests
-
machine_cpu_cores
kube_pod_container_resource_limits
-
node_memory_MemTotal_bytes
-
node_memory_MemAvailable_bytes
-
machine_memory_bytes
-
container_cpu_usage_seconds_total
-
container_memory_working_set_bytes
-
container_cpu_cfs_throttled_periods_total
kube_pod_container_status_restarts_total