MSK Dashboard 1,0841,084
12/16/2024
12/16/2024
1
AWS
>=11.2.0
Prometheus
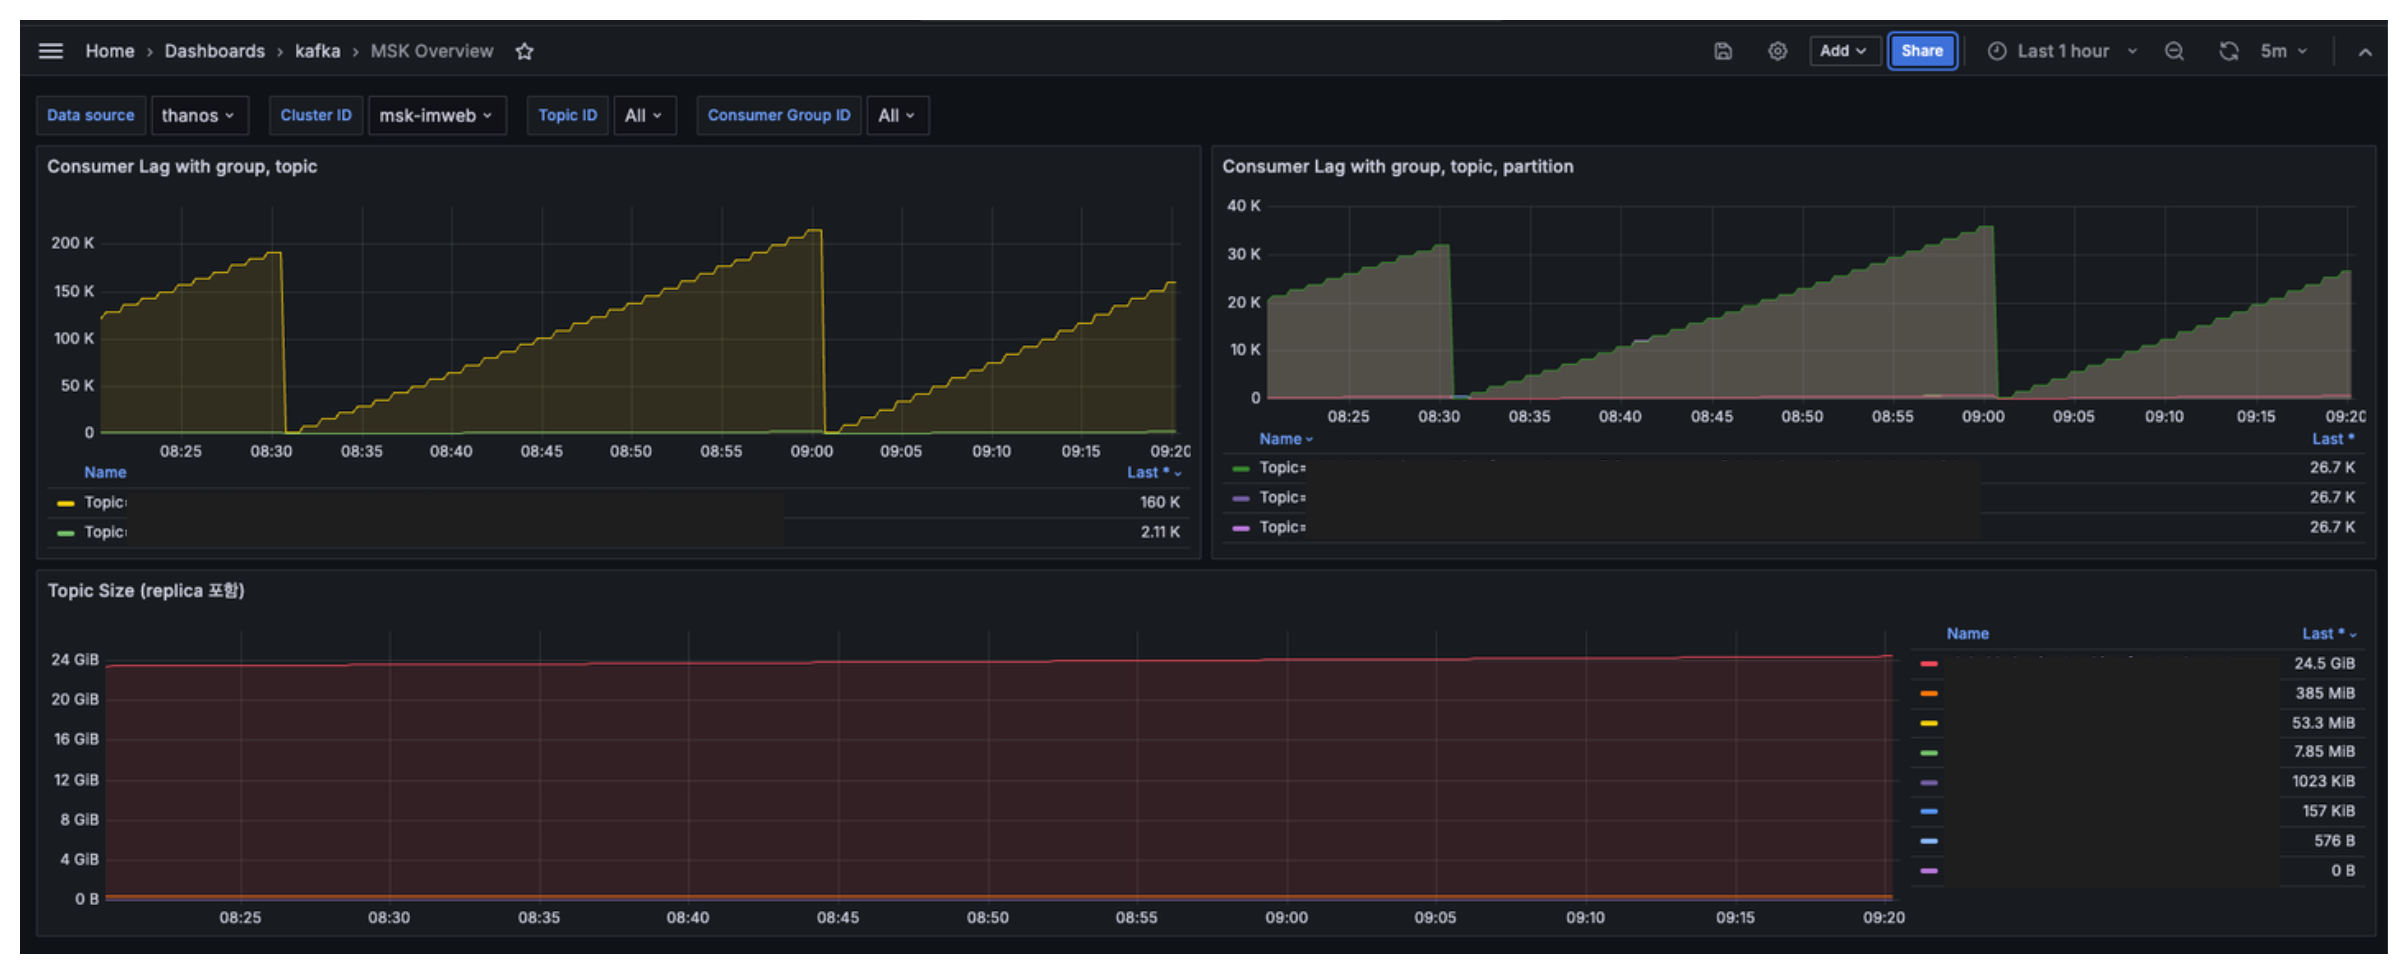
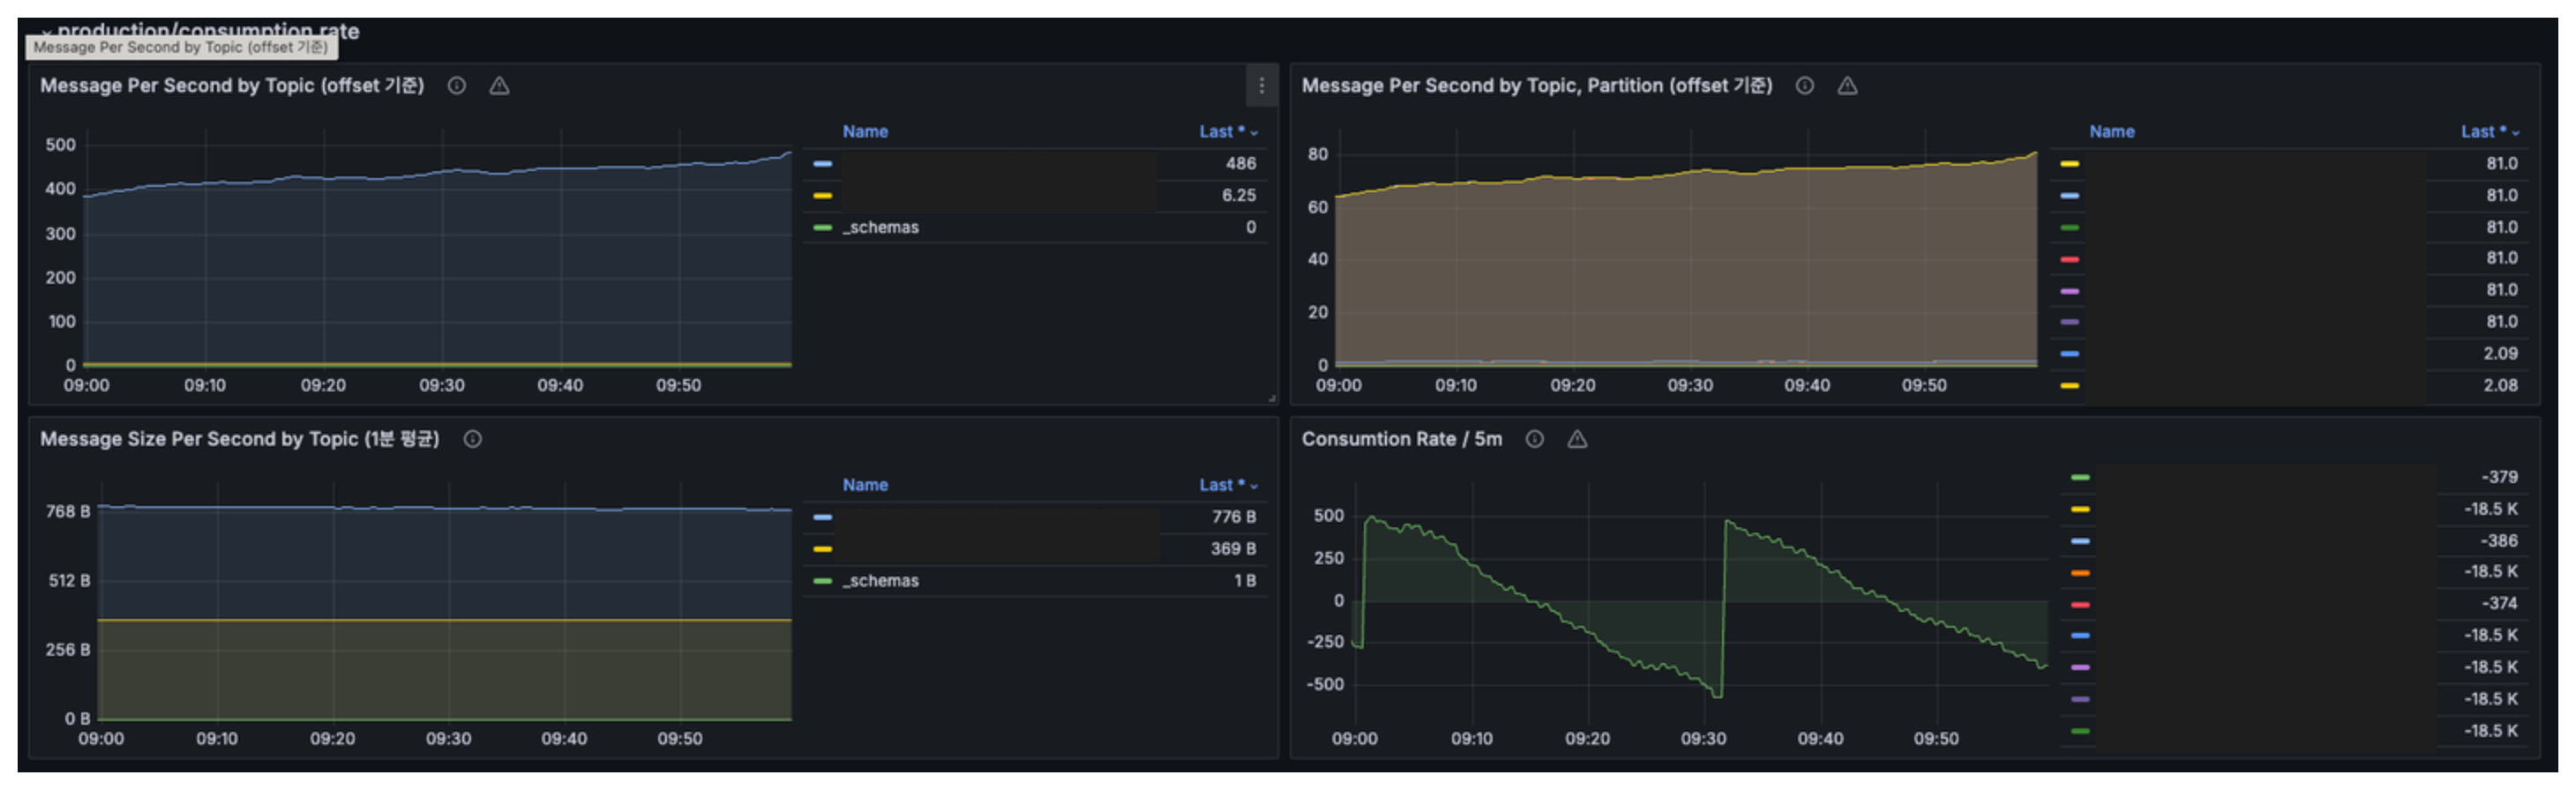
The MSK Overview dashboard uses the prometheus data source to create a Grafana dashboard with the graph panel.
Based on metrics collected by activating msk prometheus exporter (https://docs.aws.amazon.com/ko_kr/msk/latest/developerguide/open-monitoring.html)
Filtering possible by msk cluster, topic, and consumer group
Export Dashboard✕
Download
Copy to Clipboard
Used Metrics 88
kafka_consumer_group_ConsumerLagMetrics_Value
kafka_log_Log_Value
kafka_server_BrokerTopicMetrics_OneMinuteRate
kafka_server_BrokerTopicMetrics_Count
kafka_server_ReplicaManager_Value
kafka_network_RequestMetrics_Count
-
node_filesystem_avail_bytes
-
node_cpu_seconds_total