Mattermost Performance KPI Metrics 4,8104,810
Mattermost Performance KPI Metrics
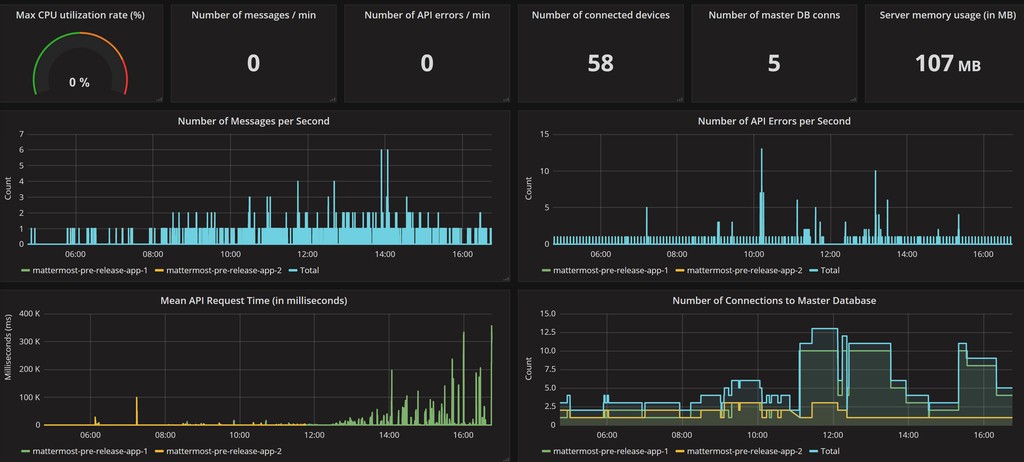
Performance monitoring support enables a Mattermost server to track system health for large Enterprise deployments through integrations with Prometheus and Grafana.
The integration supports data collection from several Mattermost servers, particularly useful if you’re running Mattermost in high availability mode.
For more information on configuration and metrics collections, visit the Mattermost documentation.
Report issues or feedback in the Mattermost forums or join the discussion in the public Developers Performance channel.
Used Metrics 1212
mattermost_process_cpu_seconds_total
mattermost_post_total
mattermost_http_errors_total
mattermost_http_websockets_total
mattermost_db_master_connections_total
-
go_memstats_alloc_bytes
mattermost_http_request_duration_seconds_sum
mattermost_http_request_duration_seconds_count
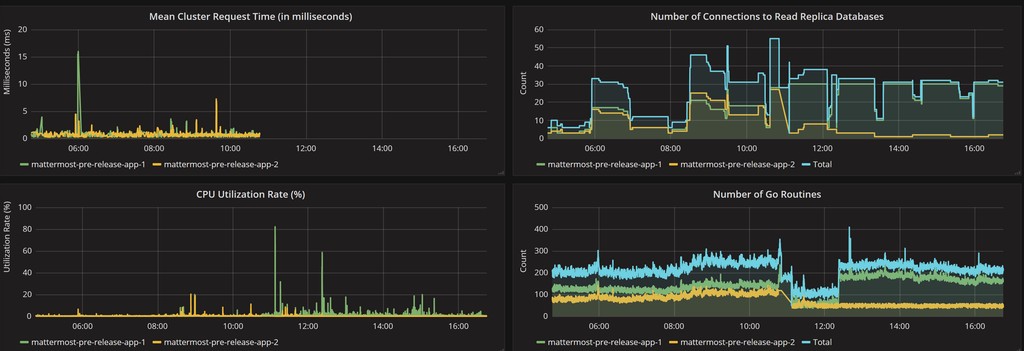
mattermost_cluster_cluster_request_duration_seconds_sum
mattermost_cluster_cluster_request_duration_seconds_count
mattermost_db_read_replica_connections_total
-
go_goroutines