Postgres Overview 190,359190,359 5.0 (1 reviews)
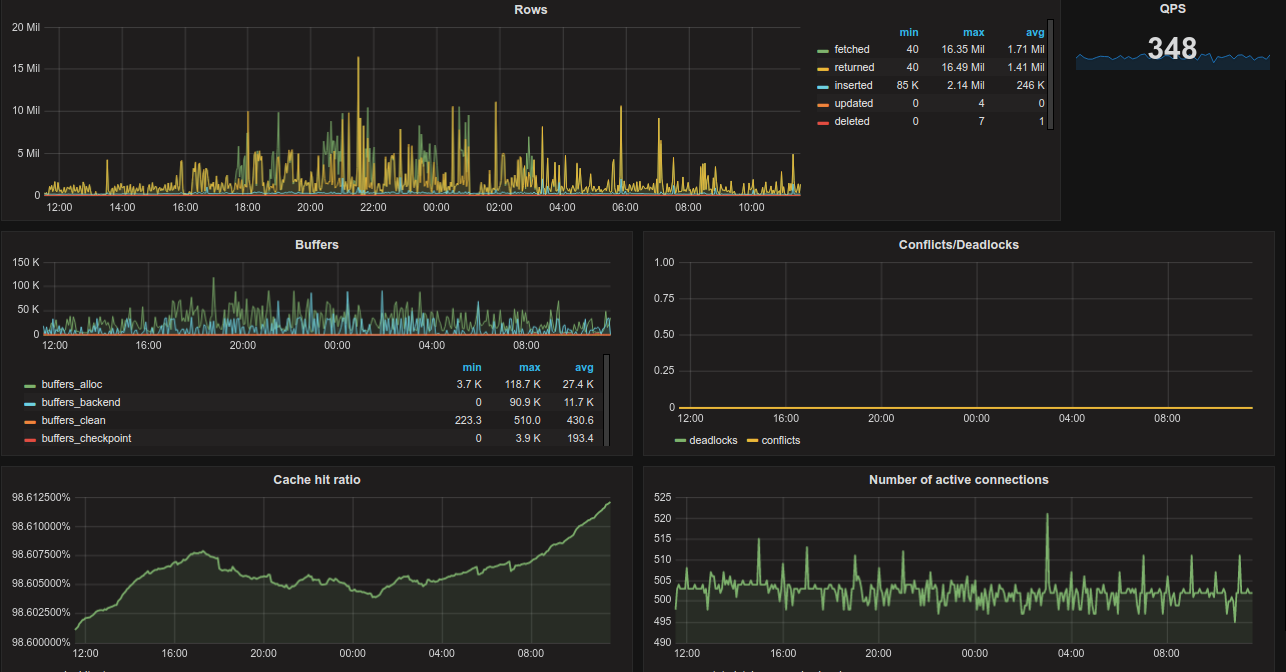
Dashboard allow to monitor:
- rows fetched/returned/inserted/updated/deleted per second
- total qps based on commits and rollbacks
- buffers state
- deadlocks and conflicts graph
- cache hit ratio graph
- number of active connections
The author assumes that the metrics are scraped from various hosts and databases. That's why there are placed two templates: $host and $db. Graphs would change accordingly to selected value.
Requirements: Dashboard is based on the https://github.com/wrouesnel/postgres_exporter metrics
Used Metrics 1717
-
pg_stat_database_tup_fetched
-
pg_stat_database_tup_returned
-
pg_stat_database_tup_inserted
-
pg_stat_database_tup_updated
-
pg_stat_database_tup_deleted
-
pg_stat_database_xact_commit
-
pg_stat_database_xact_rollback
-
pg_stat_bgwriter_buffers_alloc
-
pg_stat_bgwriter_buffers_backend_fsync
-
pg_stat_bgwriter_buffers_backend
-
pg_stat_bgwriter_buffers_clean
-
pg_stat_bgwriter_buffers_checkpoint
-
pg_stat_database_deadlocks
-
pg_stat_database_conflicts
-
pg_stat_database_blks_hit
-
pg_stat_database_blks_read
-
pg_stat_database_numbackends