Kubernetes Status 69,88469,884 5.0 (1 reviews)
3/23/2018
3/23/2018
2
Host Metrics
>=5.0.1
Prometheus
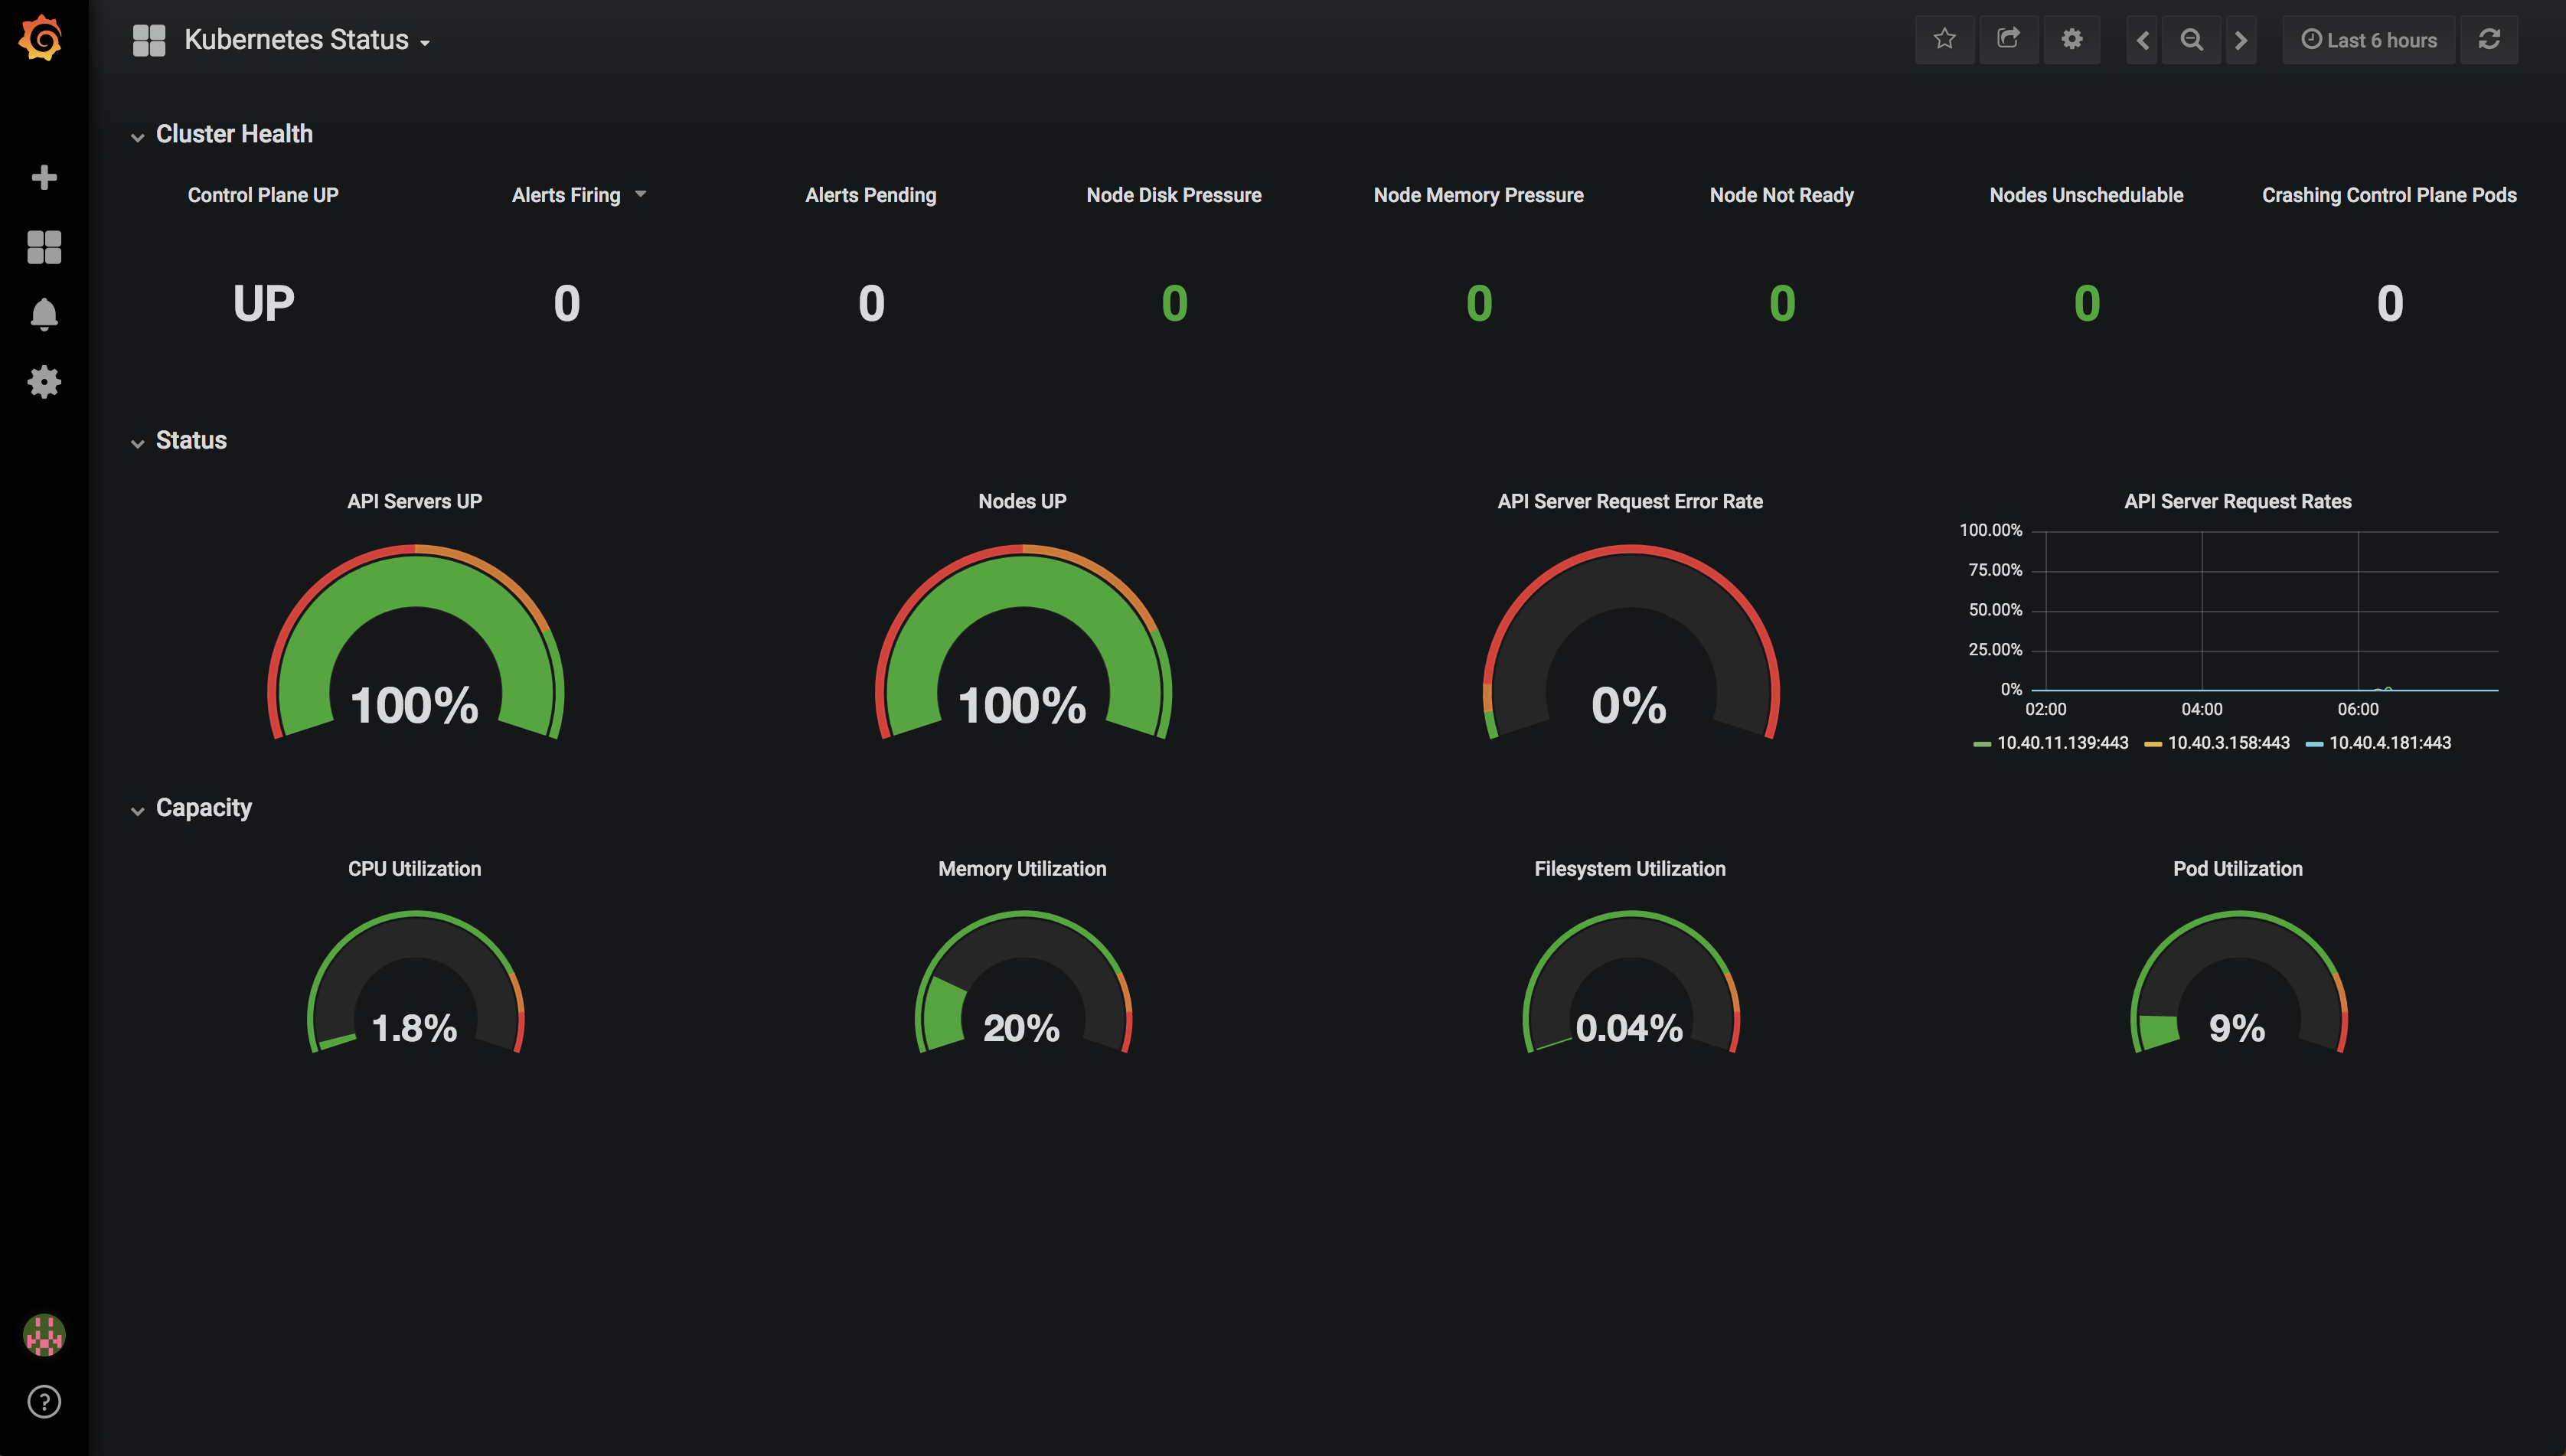
Shows the health of the overall Kubernetes Cluster at a glance.
The configuration is compatible with this instillation of Prometheus - https://github.com/kubernetes/charts/tree/master/stable/prometheus A default node exporter will also likely function.
Dashboard sources - https://github.com/sstarcher/grafana-dashboards
Export Dashboard✕
Download
Copy to Clipboard
Used Metrics 1515
-
up
ALERTS
kube_node_status_condition
kube_node_spec_unschedulable
kube_pod_container_status_restarts
apiserver_request_count
node_cpu
node_memory_MemTotal
node_memory_MemFree
node_memory_Buffers
node_memory_Cached
node_filesystem_size
node_filesystem_free
kube_node_status_capacity_pods
kube_pod_info