Micrometer Spring Throughput 5,4955,495 4.0 (1 reviews)
3/30/2018
3/31/2018
2
>=5.0.4
Prometheus
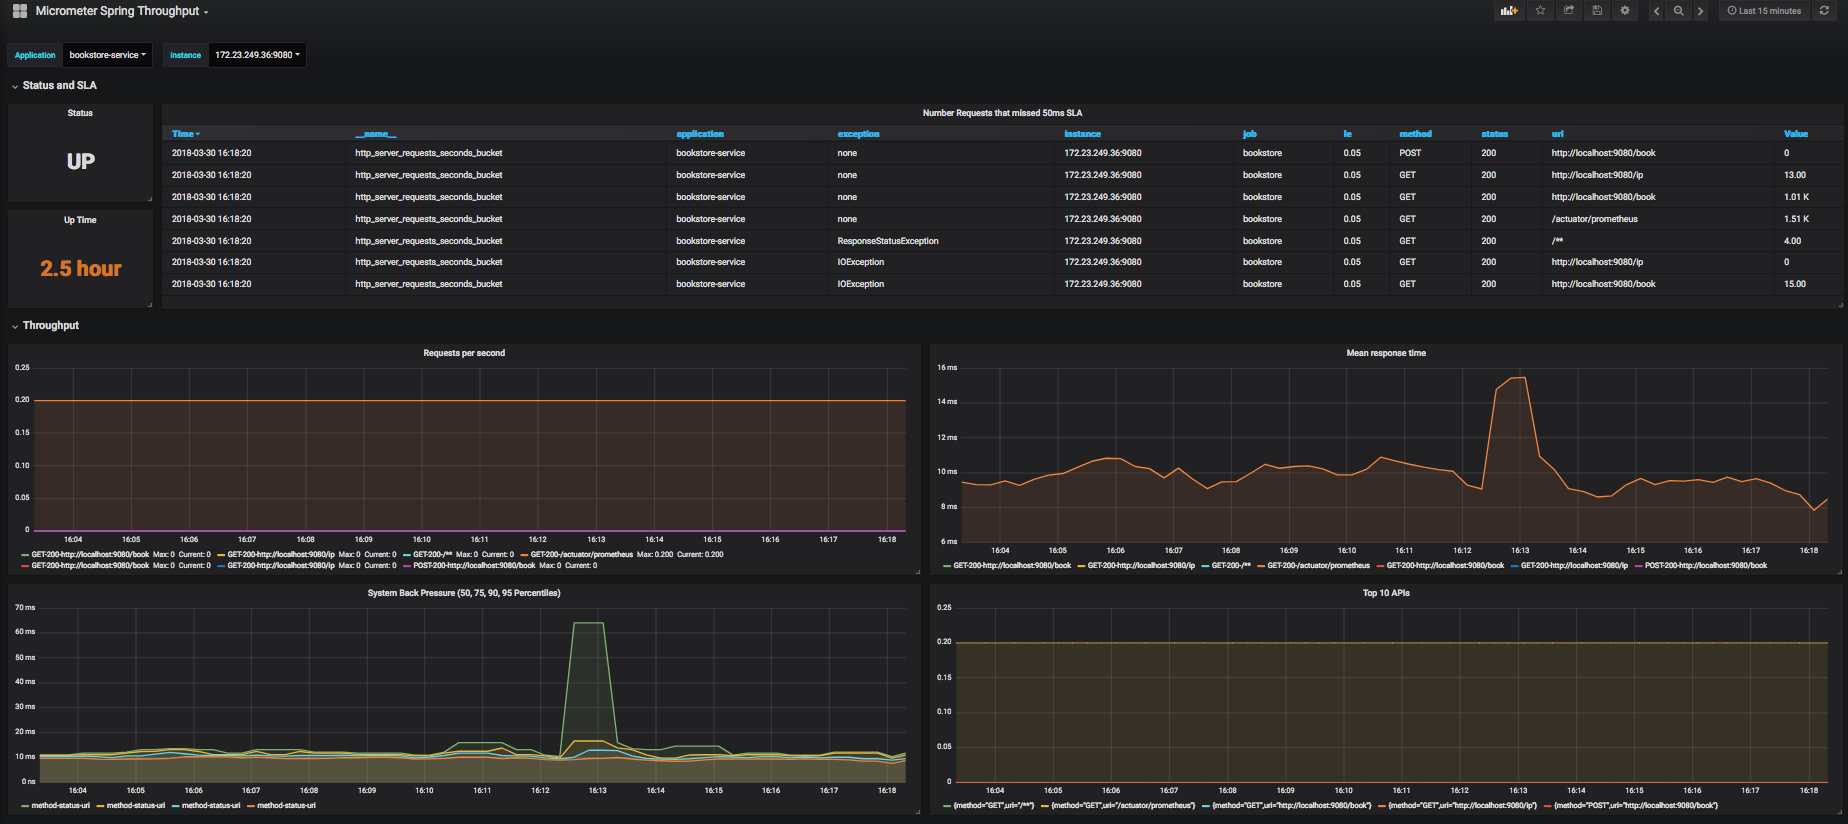
Set of panels that will provide use representation of Throughput and Response time of Springboot services.
For support or help please contact on twitter - https://twitter.com/zeagord.
Export Dashboard✕
Download
Copy to Clipboard
Used Metrics 66
-
up
http_server_requests_seconds_bucket
process_uptime_seconds
http_server_requests_seconds_count
http_server_requests_seconds_sum
topk