Nifi_Metrics 14,42114,421
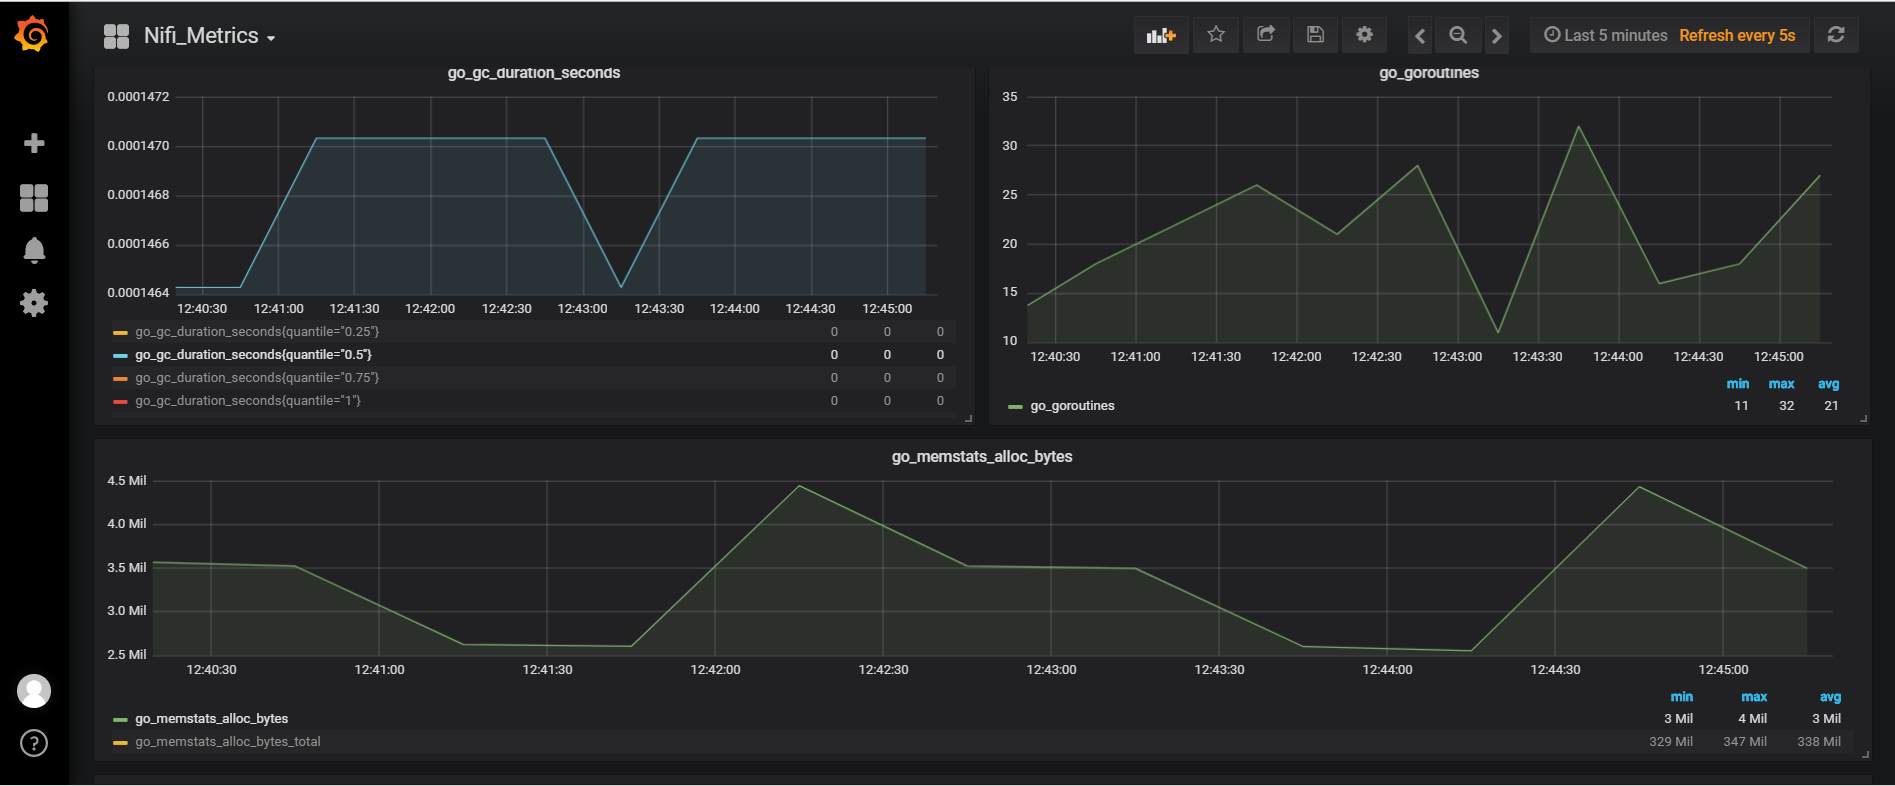
This dashboard is used to monitor the metrics related to NiFi. The metrics from NiFi cannot be scraped directly by the Prometheus, rather we make use of PushGateway to which the NiFi sends the metrics data and this data is collected by Prometheus from the Pushgateway.
Used Metrics 5151
-
go_gc_duration_seconds
go_gc_duration_seconds_count
go_gc_duration_seconds_sum
-
go_goroutines
-
go_memstats_alloc_bytes
-
go_memstats_alloc_bytes_total
-
go_memstats_gc_cpu_fraction
-
go_memstats_gc_sys_bytes
-
go_memstats_heap_alloc_bytes
-
go_memstats_heap_idle_bytes
-
go_memstats_heap_inuse_bytes
-
go_memstats_heap_objects
-
go_memstats_heap_released_bytes
-
go_memstats_heap_sys_bytes
-
go_memstats_mallocs_total
-
go_memstats_mcache_inuse_bytes
-
go_memstats_mcache_sys_bytes
-
go_memstats_mspan_inuse_bytes
-
go_memstats_mspan_sys_bytes
-
go_memstats_stack_inuse_bytes
-
go_memstats_stack_sys_bytes
-
go_memstats_buck_hash_sys_bytes
-
go_memstats_frees_total
-
go_memstats_last_gc_time_seconds
-
go_memstats_lookups_total
-
go_memstats_next_gc_bytes
-
go_memstats_other_sys_bytes
-
go_memstats_sys_bytes
-
go_threads
-
http_request_duration_microseconds
http_request_duration_microseconds_count
http_request_duration_microseconds_sum
-
http_request_size_bytes
http_request_size_bytes_count
http_request_size_bytes_sum
-
http_requests_total
-
http_response_size_bytes
http_response_size_bytes_count
http_response_size_bytes_sum
-
process_cpu_seconds_total
process_group_amount_bytes_total
process_group_amount_flowfiles_total
process_group_amount_items
process_group_amount_threads_total
process_group_size_content_total
-
process_max_fds
-
process_open_fds
-
process_resident_memory_bytes
-
process_start_time_seconds
-
process_virtual_memory_bytes
pushgateway_build_info