Kubernetes Pods (Prometheus) 226,955226,955 5.0 (1 reviews)
5/31/2018
6/6/2018
1
Docker
>=4.6.2
Prometheus
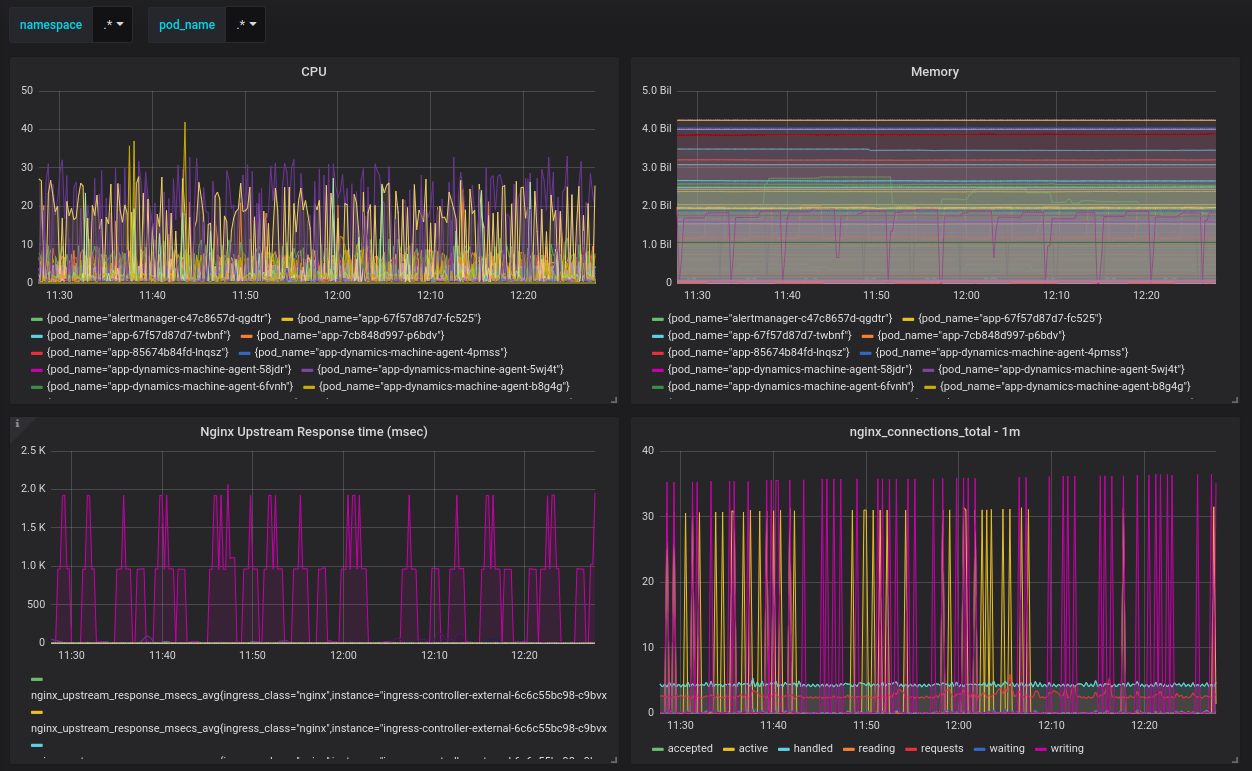
This dashboard will let you select the namespace and pod name or by regex/wildcard and display key metrics for the Kubernetes Pods.
Source repository: https://github.com/sekka1/cloud-public/tree/master/kubernetes/grafana-dashboards/kubernetes-pods
Use this Helm chart to launch Grafana into a Kubernetes cluster. It will include this dashboard and many more dashboards to give you visibility into the Kubernetes Cluster. (https://github.com/sekka1/cloud-public/tree/master/kubernetes/pods/grafana-helm)
Export Dashboard✕
Download
Copy to Clipboard
Used Metrics 66
-
container_cpu_usage_seconds_total
-
container_memory_working_set_bytes
nginx_upstream_response_msecs_avg
nginx_connections_total
-
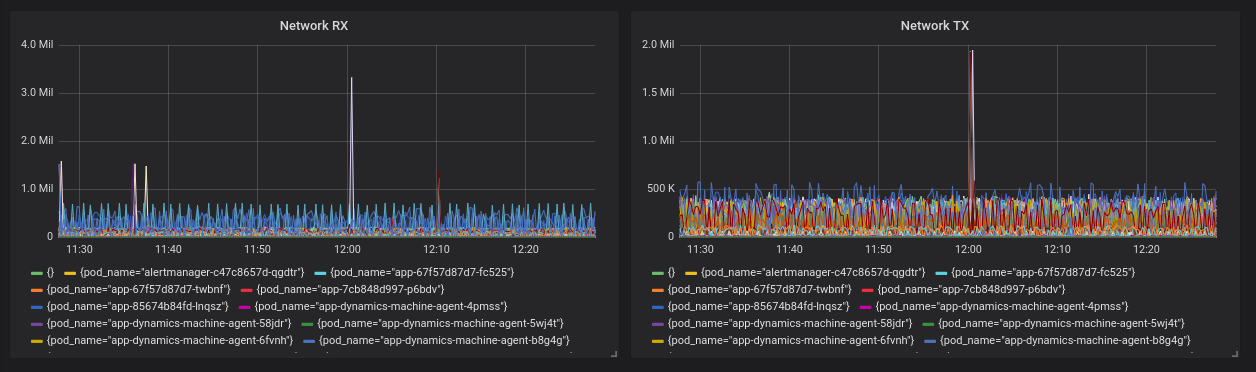
container_network_receive_bytes_total
-
container_network_transmit_bytes_total