Kubernetes pod and cluster monitoring (via Prometheus) 150,293150,293
6/26/2018
7/15/2018
1
>=5.0.4
Prometheus
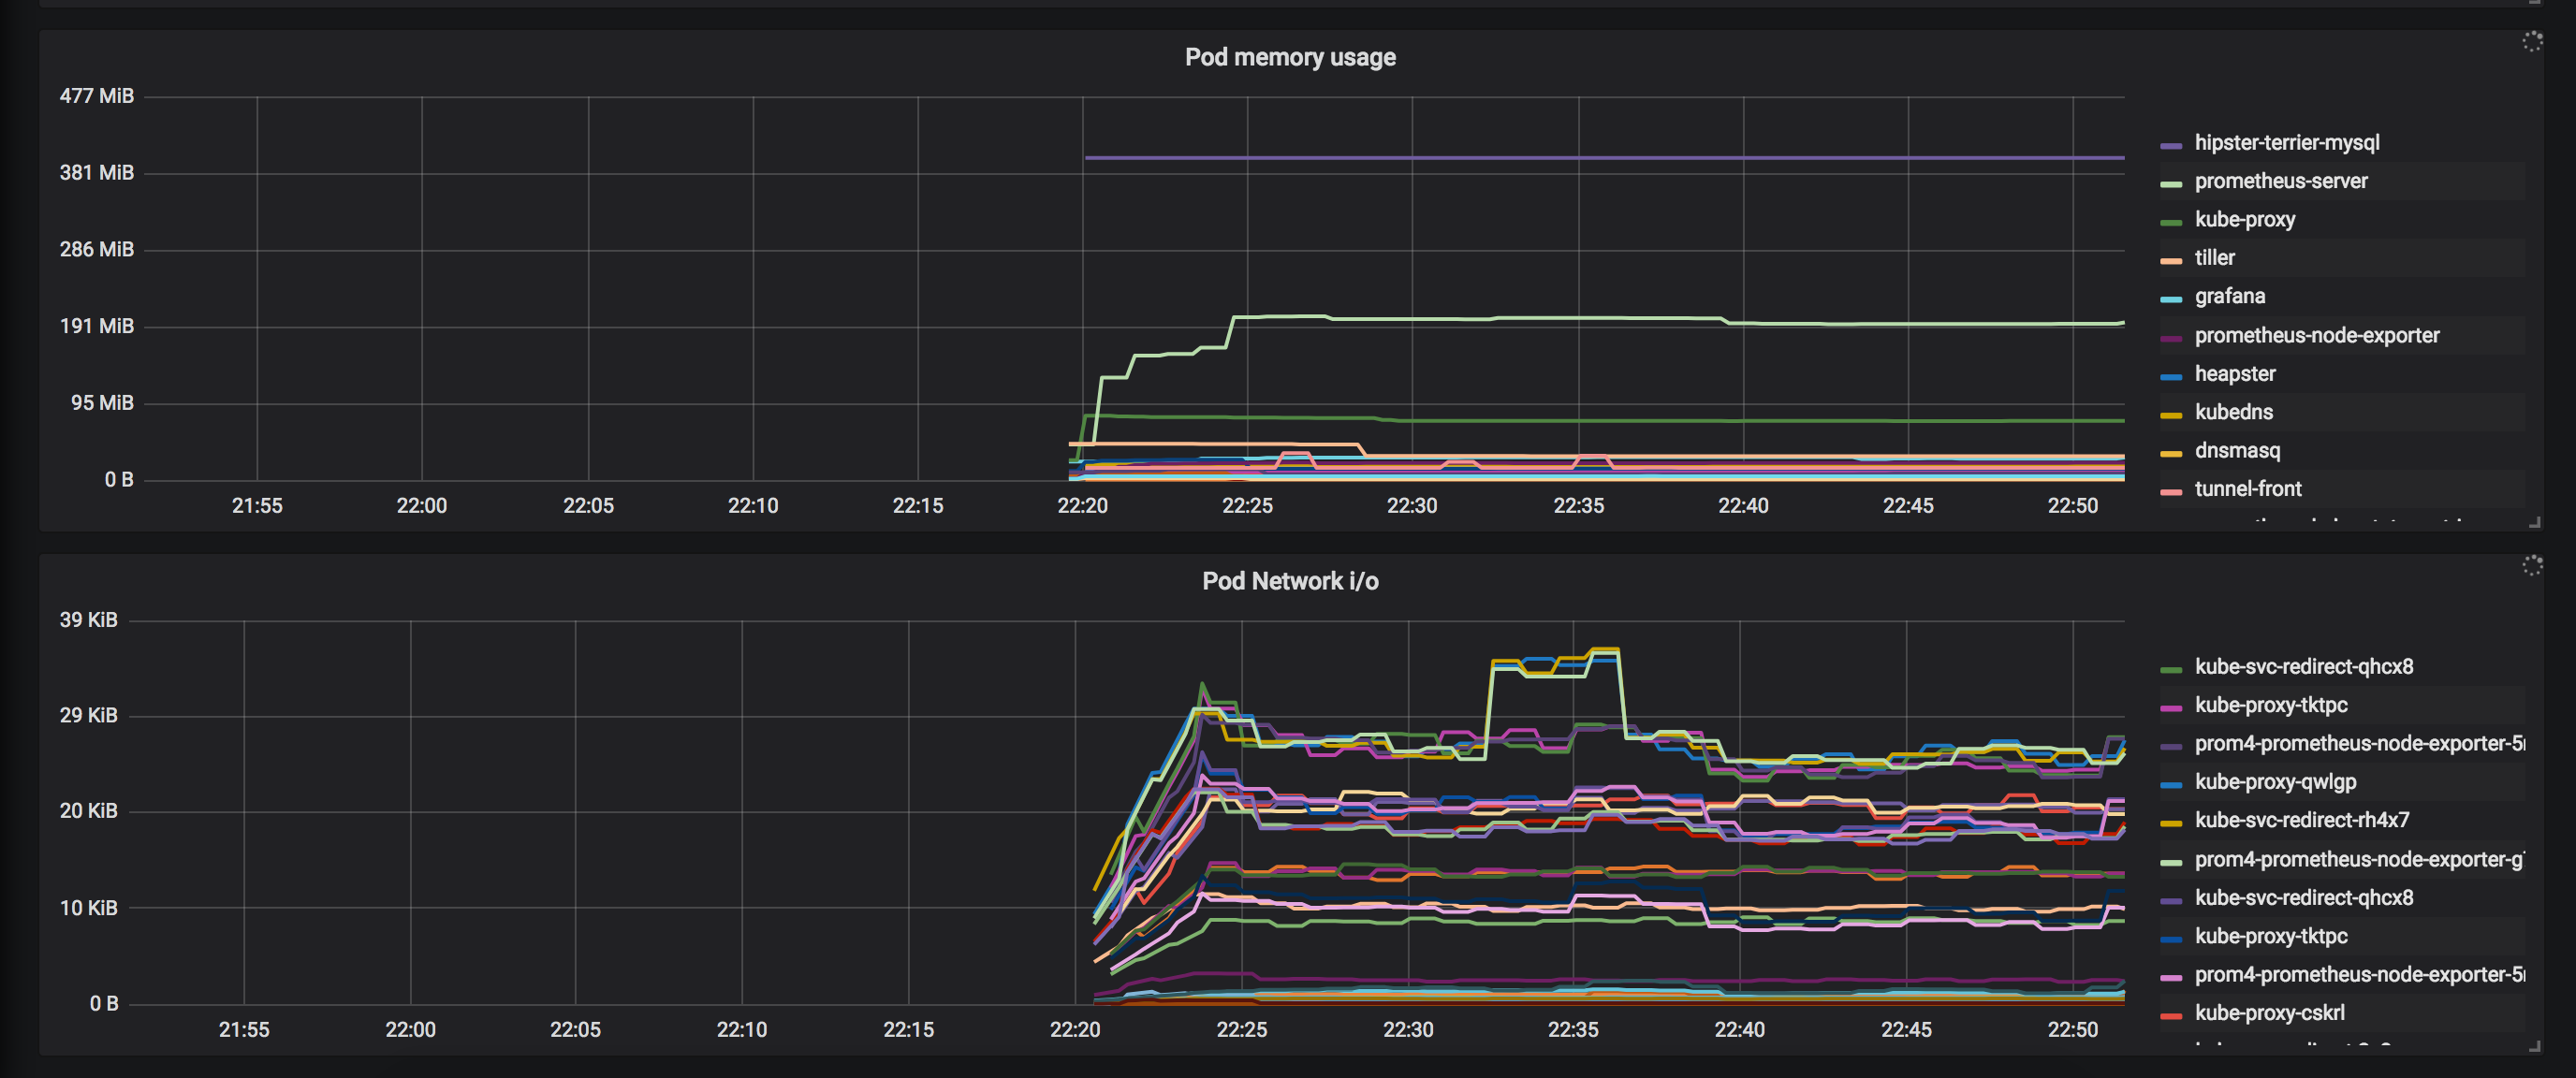
Monitor a Kubernetes cluster using Prometheus TSDB. Shows overall cluster CPU / Memory / Disk usage as well as individual pod statistics.
This is a modified version of dashboard #162 to work with Prometheus 2.1+.
Note - Managed Kubernetes instances (such as Azure AKS) might not give you access to Filesystem stats, as you can see in the screenshot.
Export Dashboard✕
Download
Copy to Clipboard
Used Metrics 1111
node_memory_MemTotal
node_memory_MemFree
node_memory_Buffers
node_memory_Cached
-
container_cpu_usage_seconds_total
node_cpu
node_filesystem_size
node_filesystem_free
-
container_memory_usage_bytes
-
container_network_receive_bytes_total
-
container_network_transmit_bytes_total