Spring Boot Statistics 37,68437,684 4.0 (4 reviews)
Exporter
This dashboard uses the following exporter metrics.
Variables
This dashboard requires the following Variables.
- $instance - Instance Name
- $application - Spring Boot Application Name
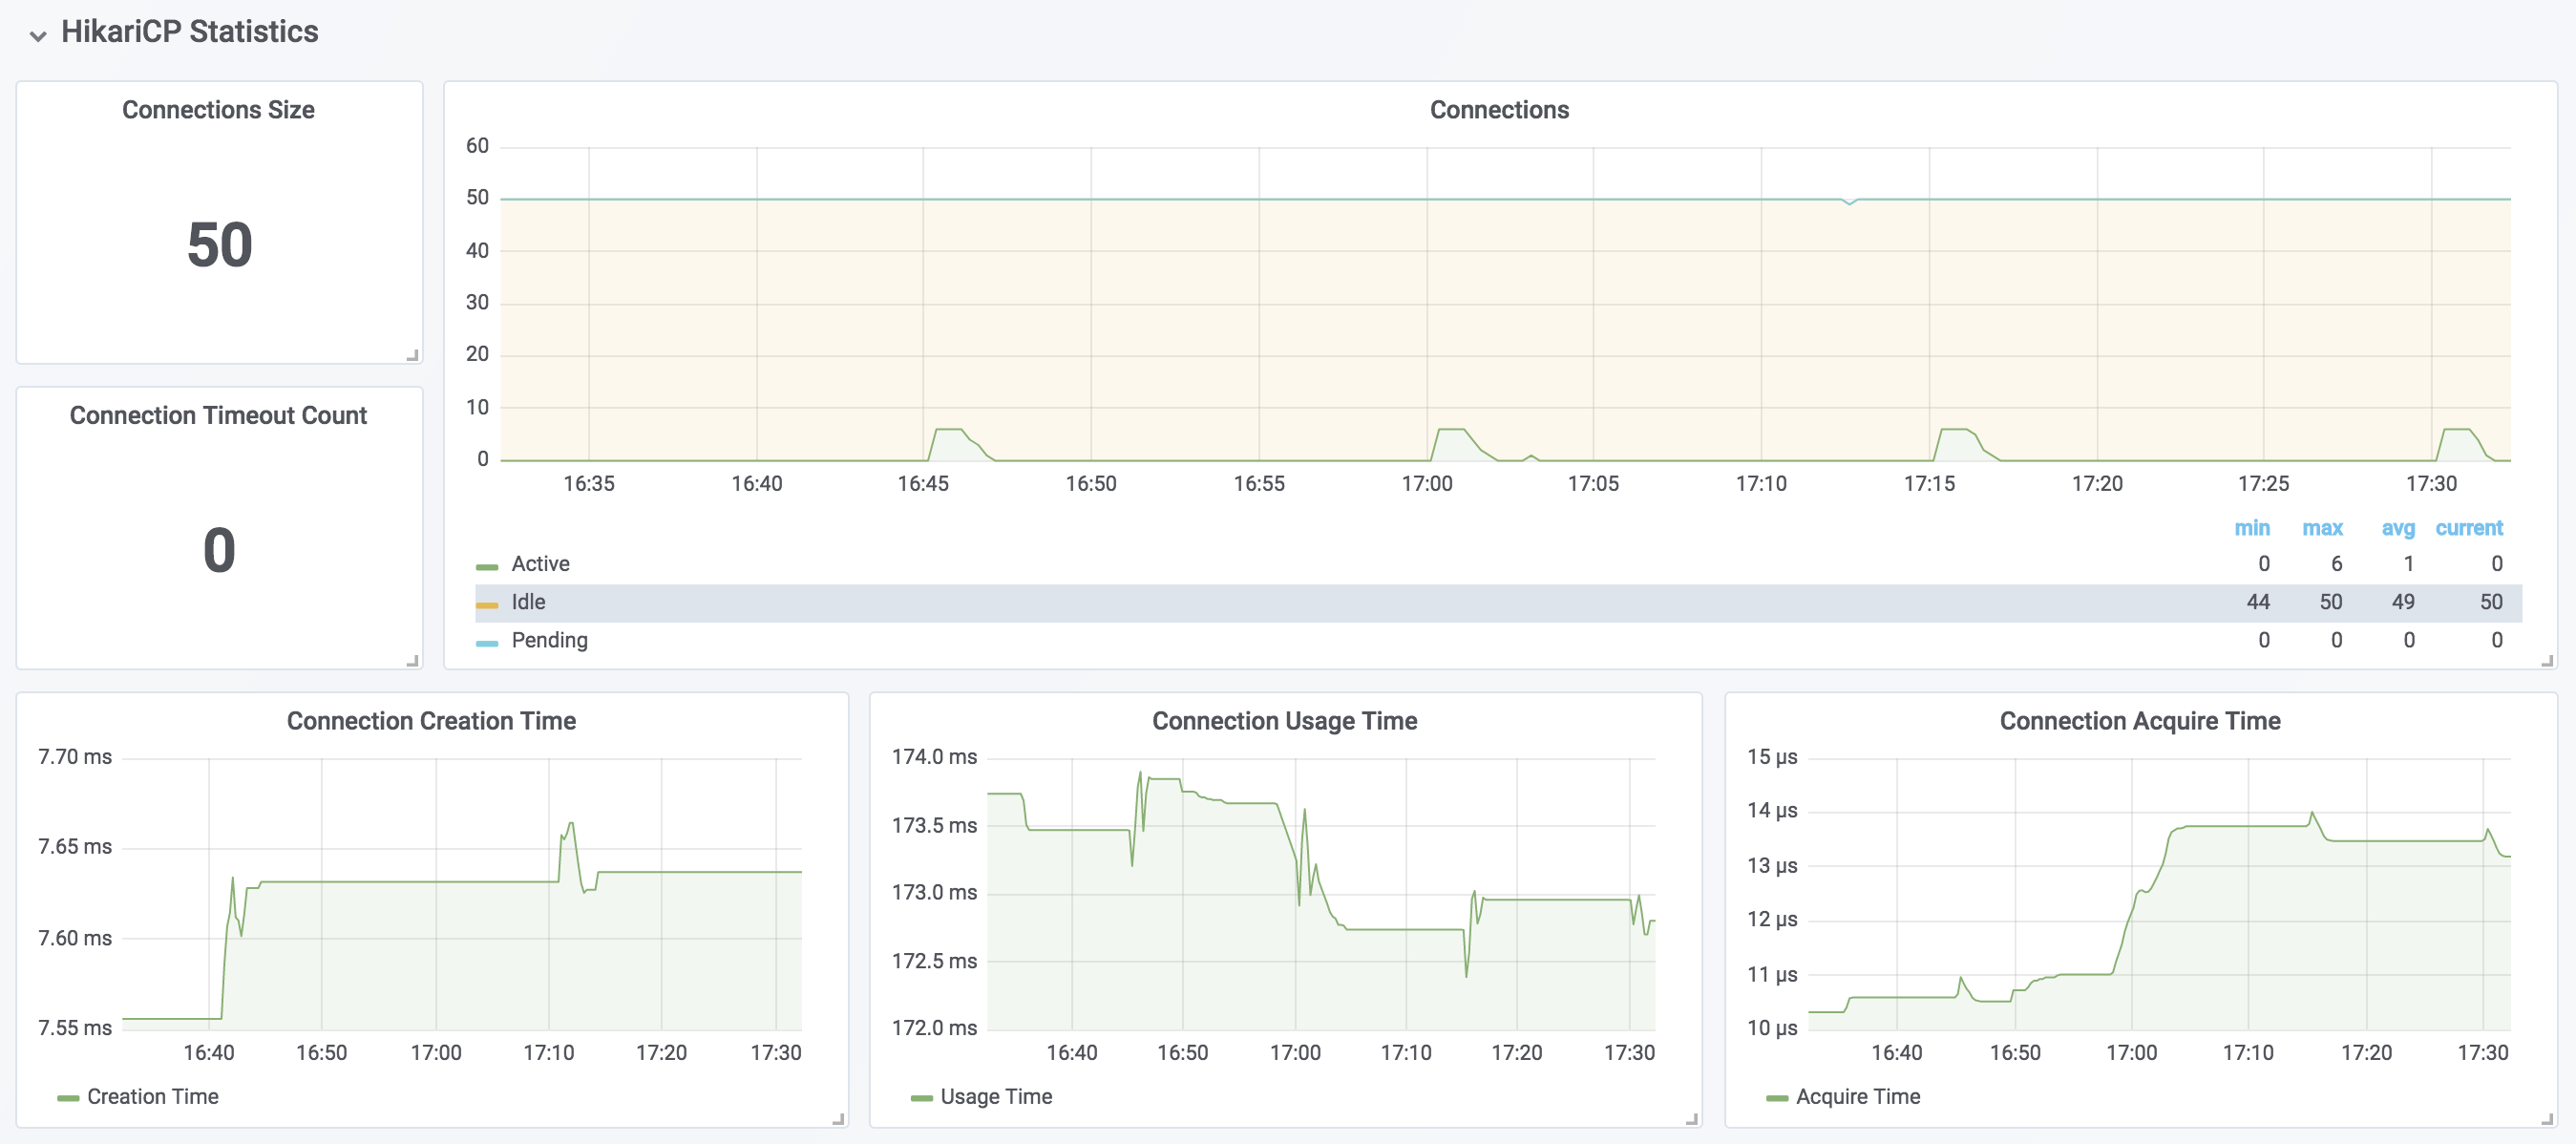
- $hikaricp - HikariCP Connection Pool Name
$application should be marked with prometheus.yml label or with Spring bean(See below).
@Bean
MeterRegistryCustomizer<MeterRegistry> metricsCommonTags() {
  return registry -> registry.config().commonTags("application", "MYAPPNAME");
}
Used Metrics 4343
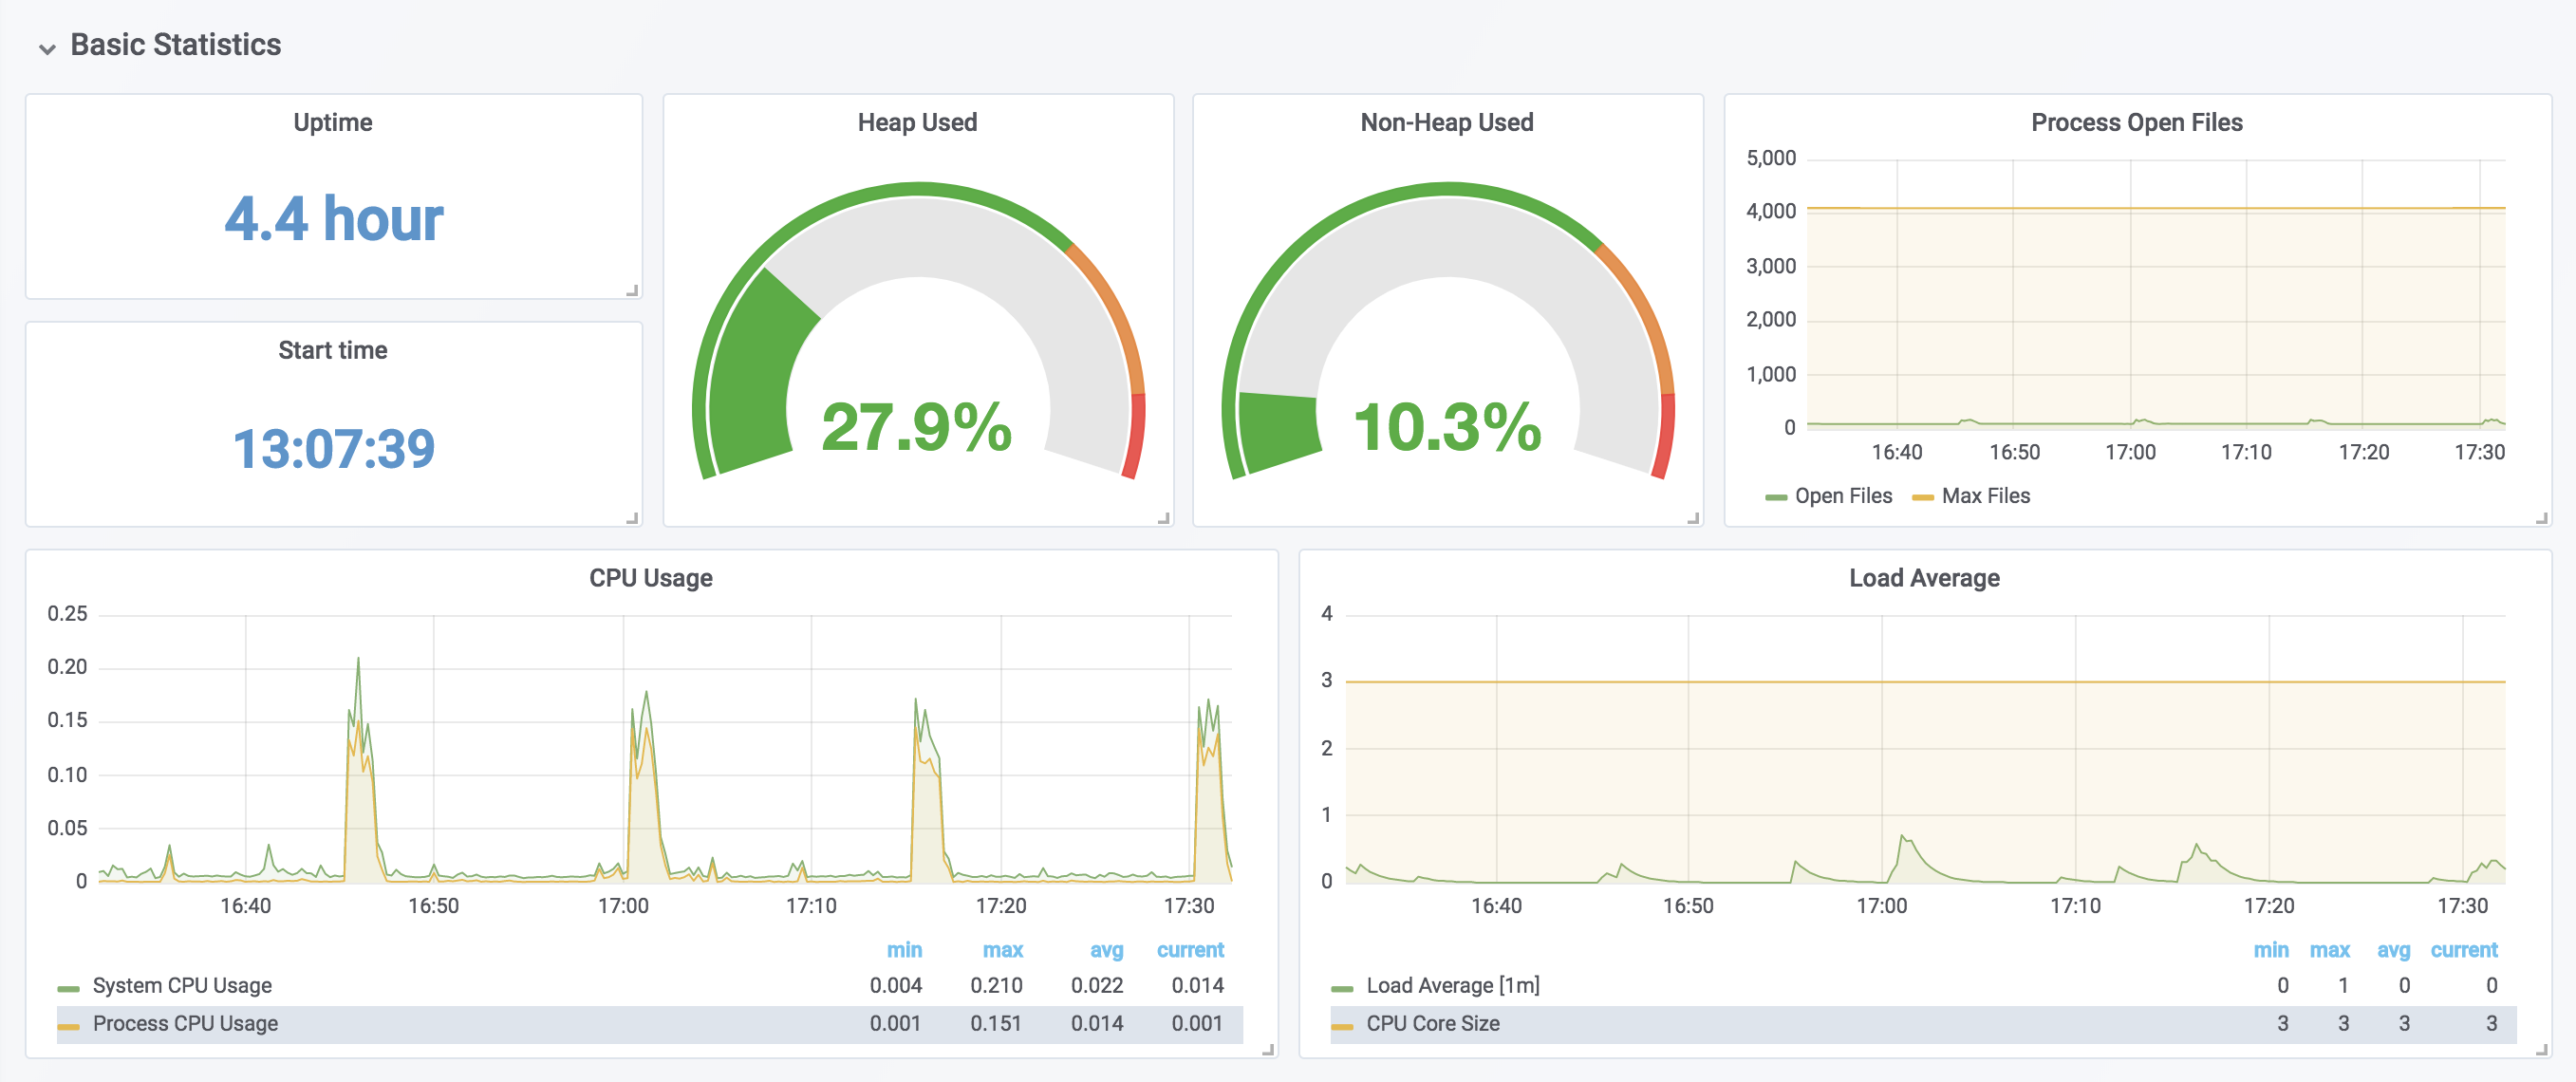
process_uptime_seconds
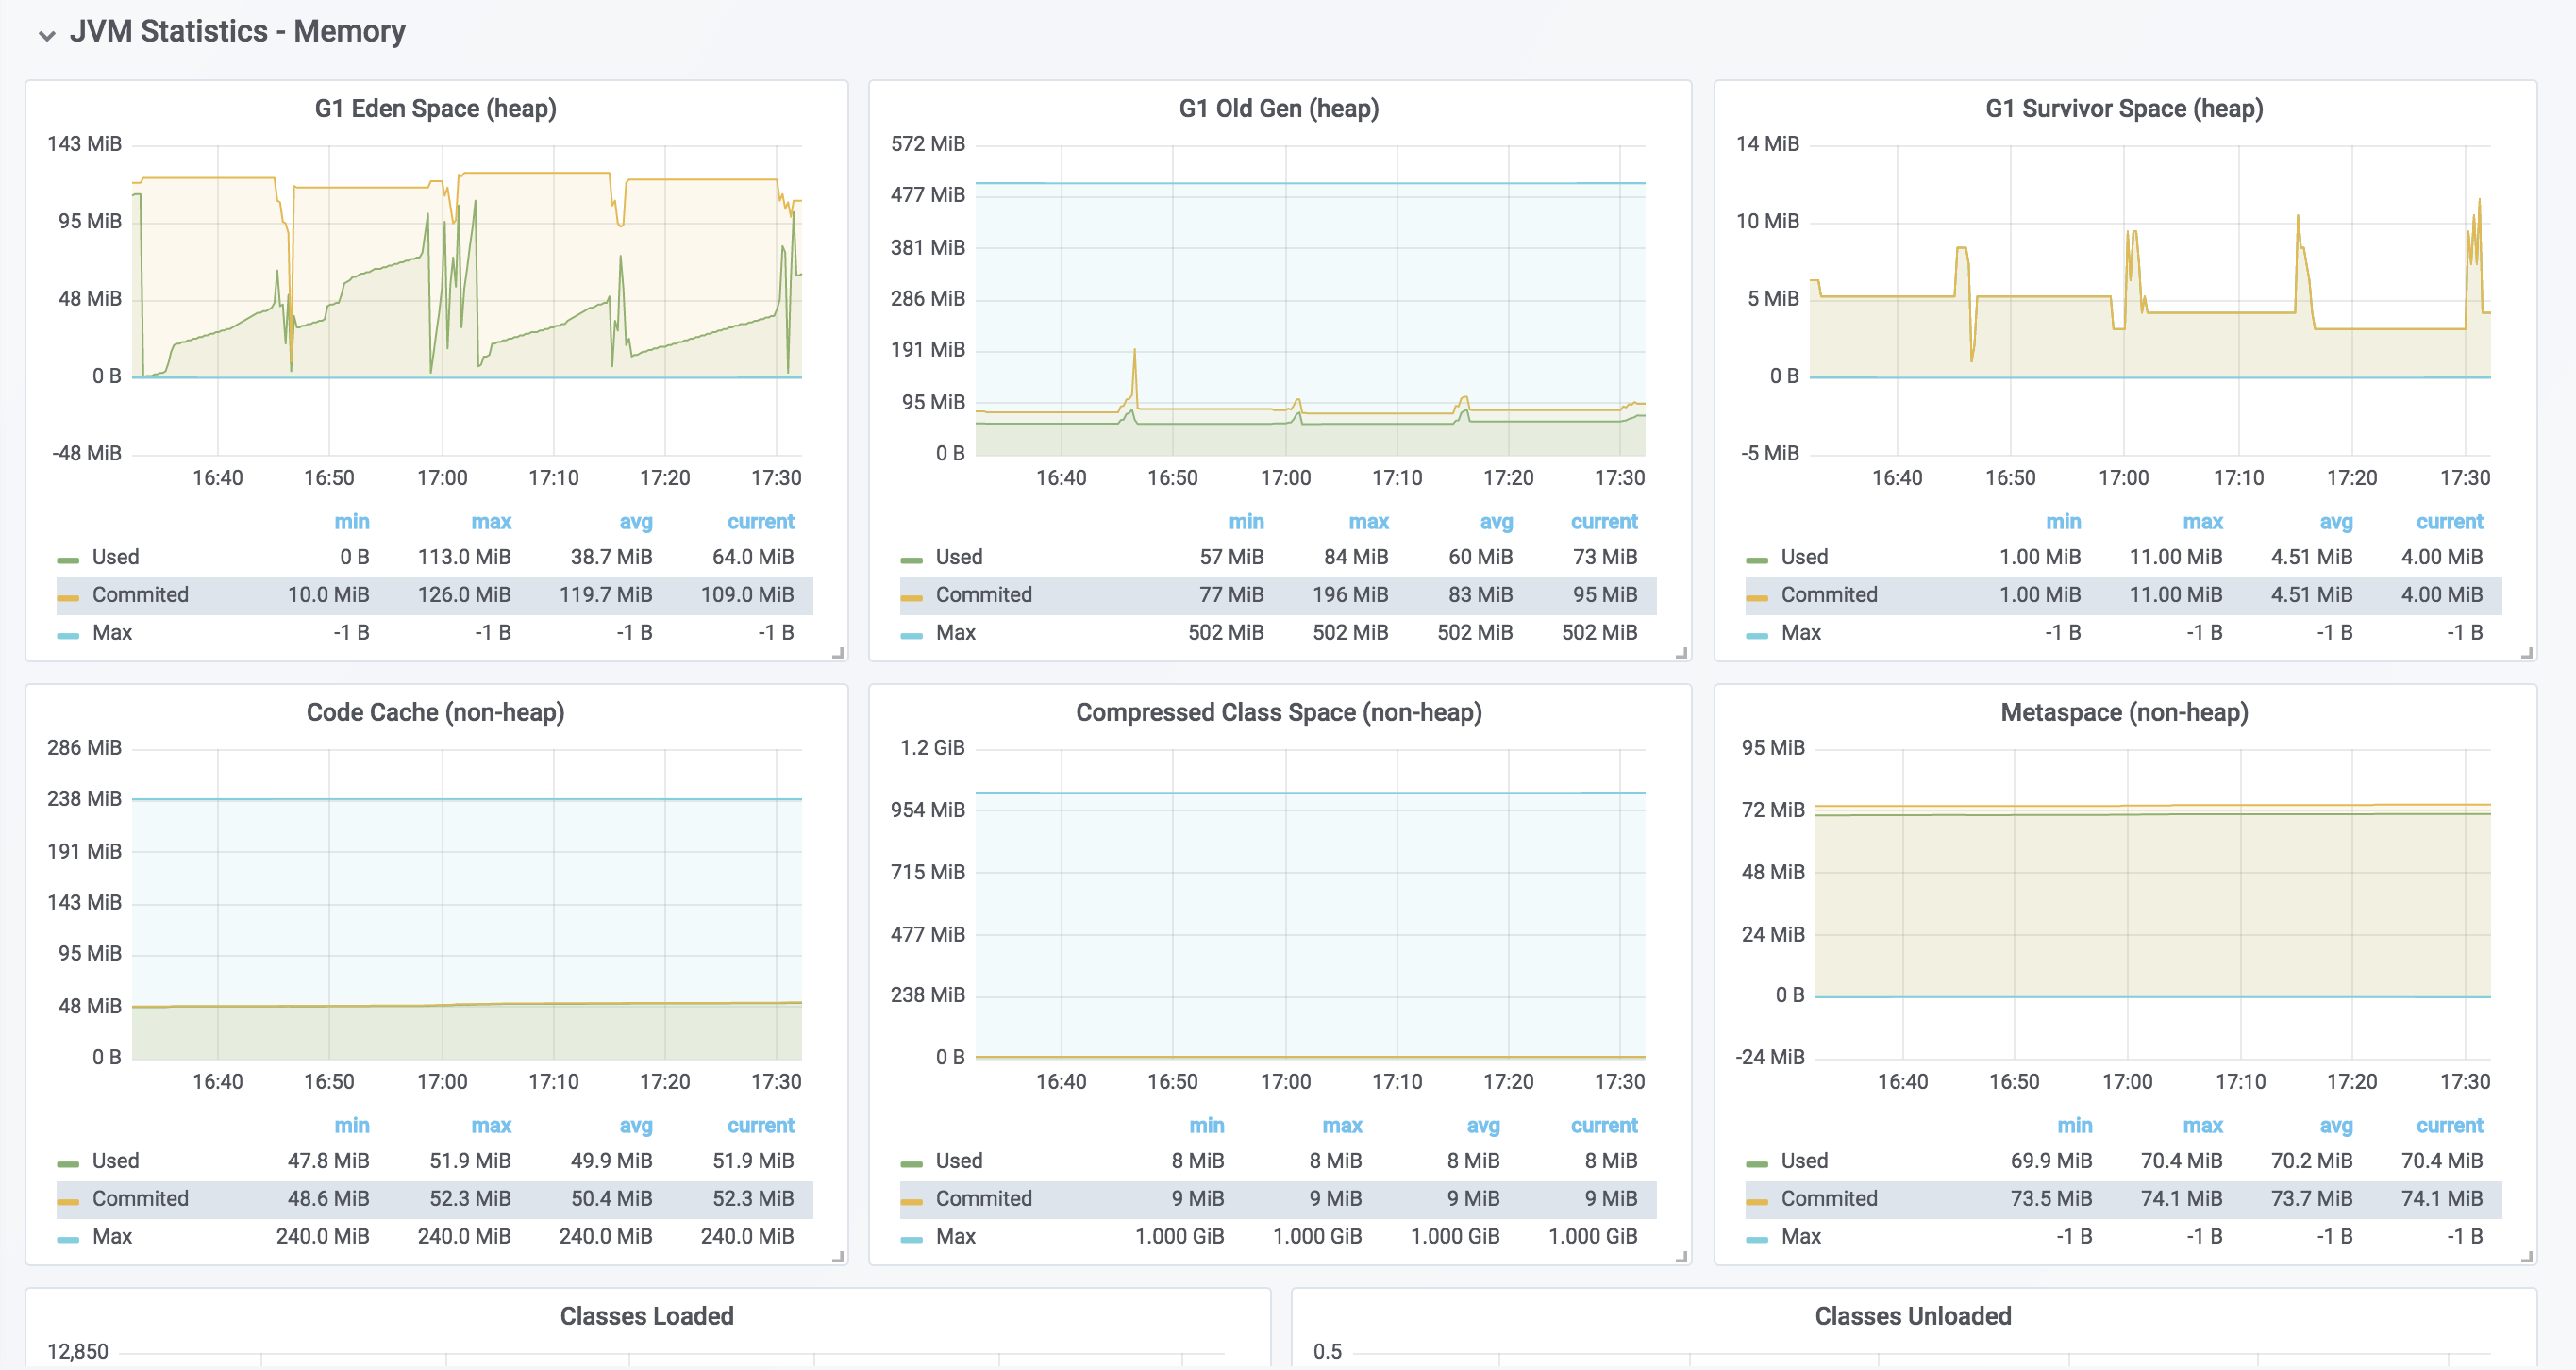
jvm_memory_used_bytes
jvm_memory_max_bytes
process_files_open
process_files_max
-
process_start_time_seconds
system_cpu_usage
process_cpu_usage
system_load_average_
system_cpu_count
jvm_memory_committed_bytes
jvm_classes_unloaded_total
jvm_buffer_memory_used_bytes
jvm_buffer_total_capacity_bytes
jvm_gc_memory_allocated_bytes_total
jvm_gc_memory_promoted_bytes_total
jvm_classes_loaded
jvm_threads_daemon
jvm_threads_live
jvm_threads_peak
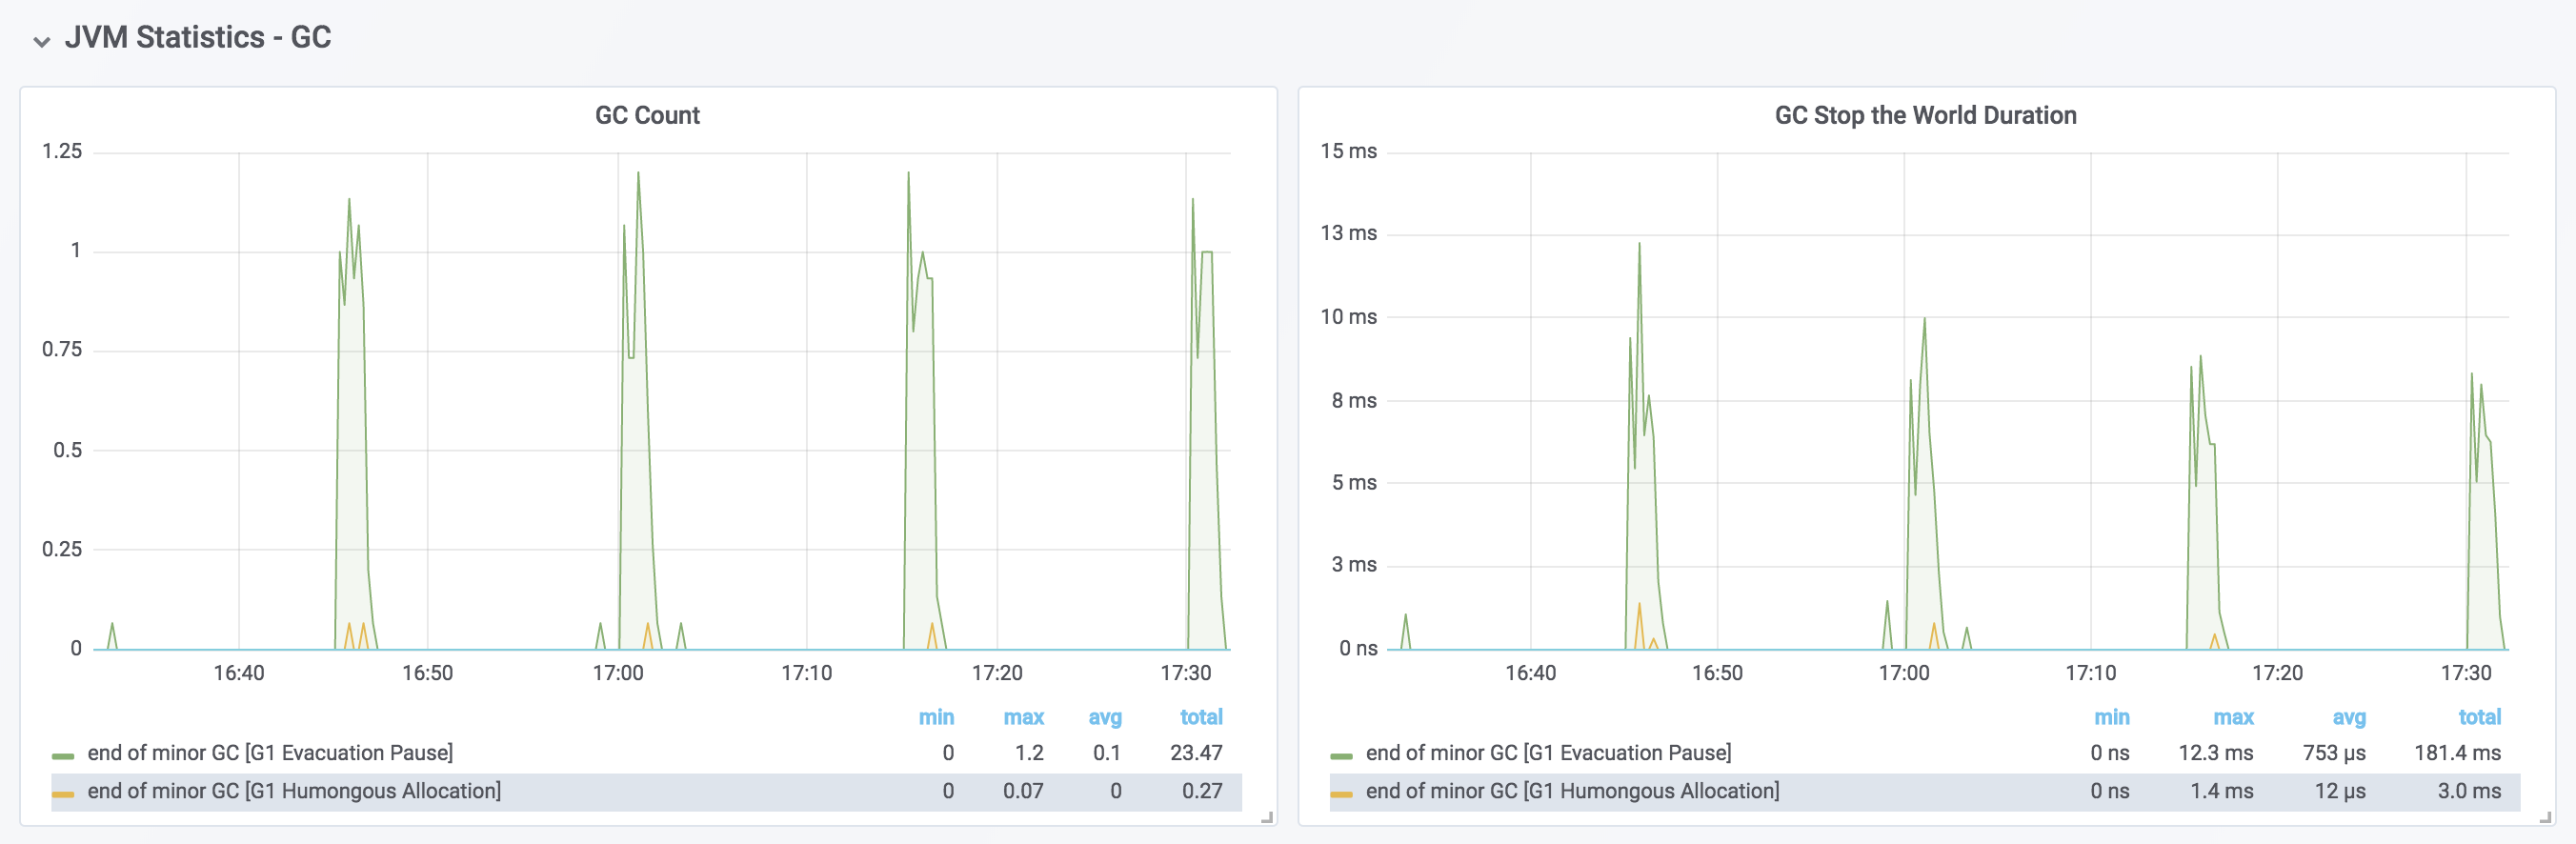
jvm_gc_pause_seconds_count
jvm_gc_pause_seconds_sum
hikaricp_connections
hikaricp_connections_active
hikaricp_connections_idle
hikaricp_connections_pending
hikaricp_connections_timeout_total
hikaricp_connections_creation_seconds_sum
hikaricp_connections_creation_seconds_count
hikaricp_connections_usage_seconds_sum
hikaricp_connections_usage_seconds_count
hikaricp_connections_acquire_seconds_sum
hikaricp_connections_acquire_seconds_count
http_server_requests_seconds_count
http_server_requests_seconds_sum
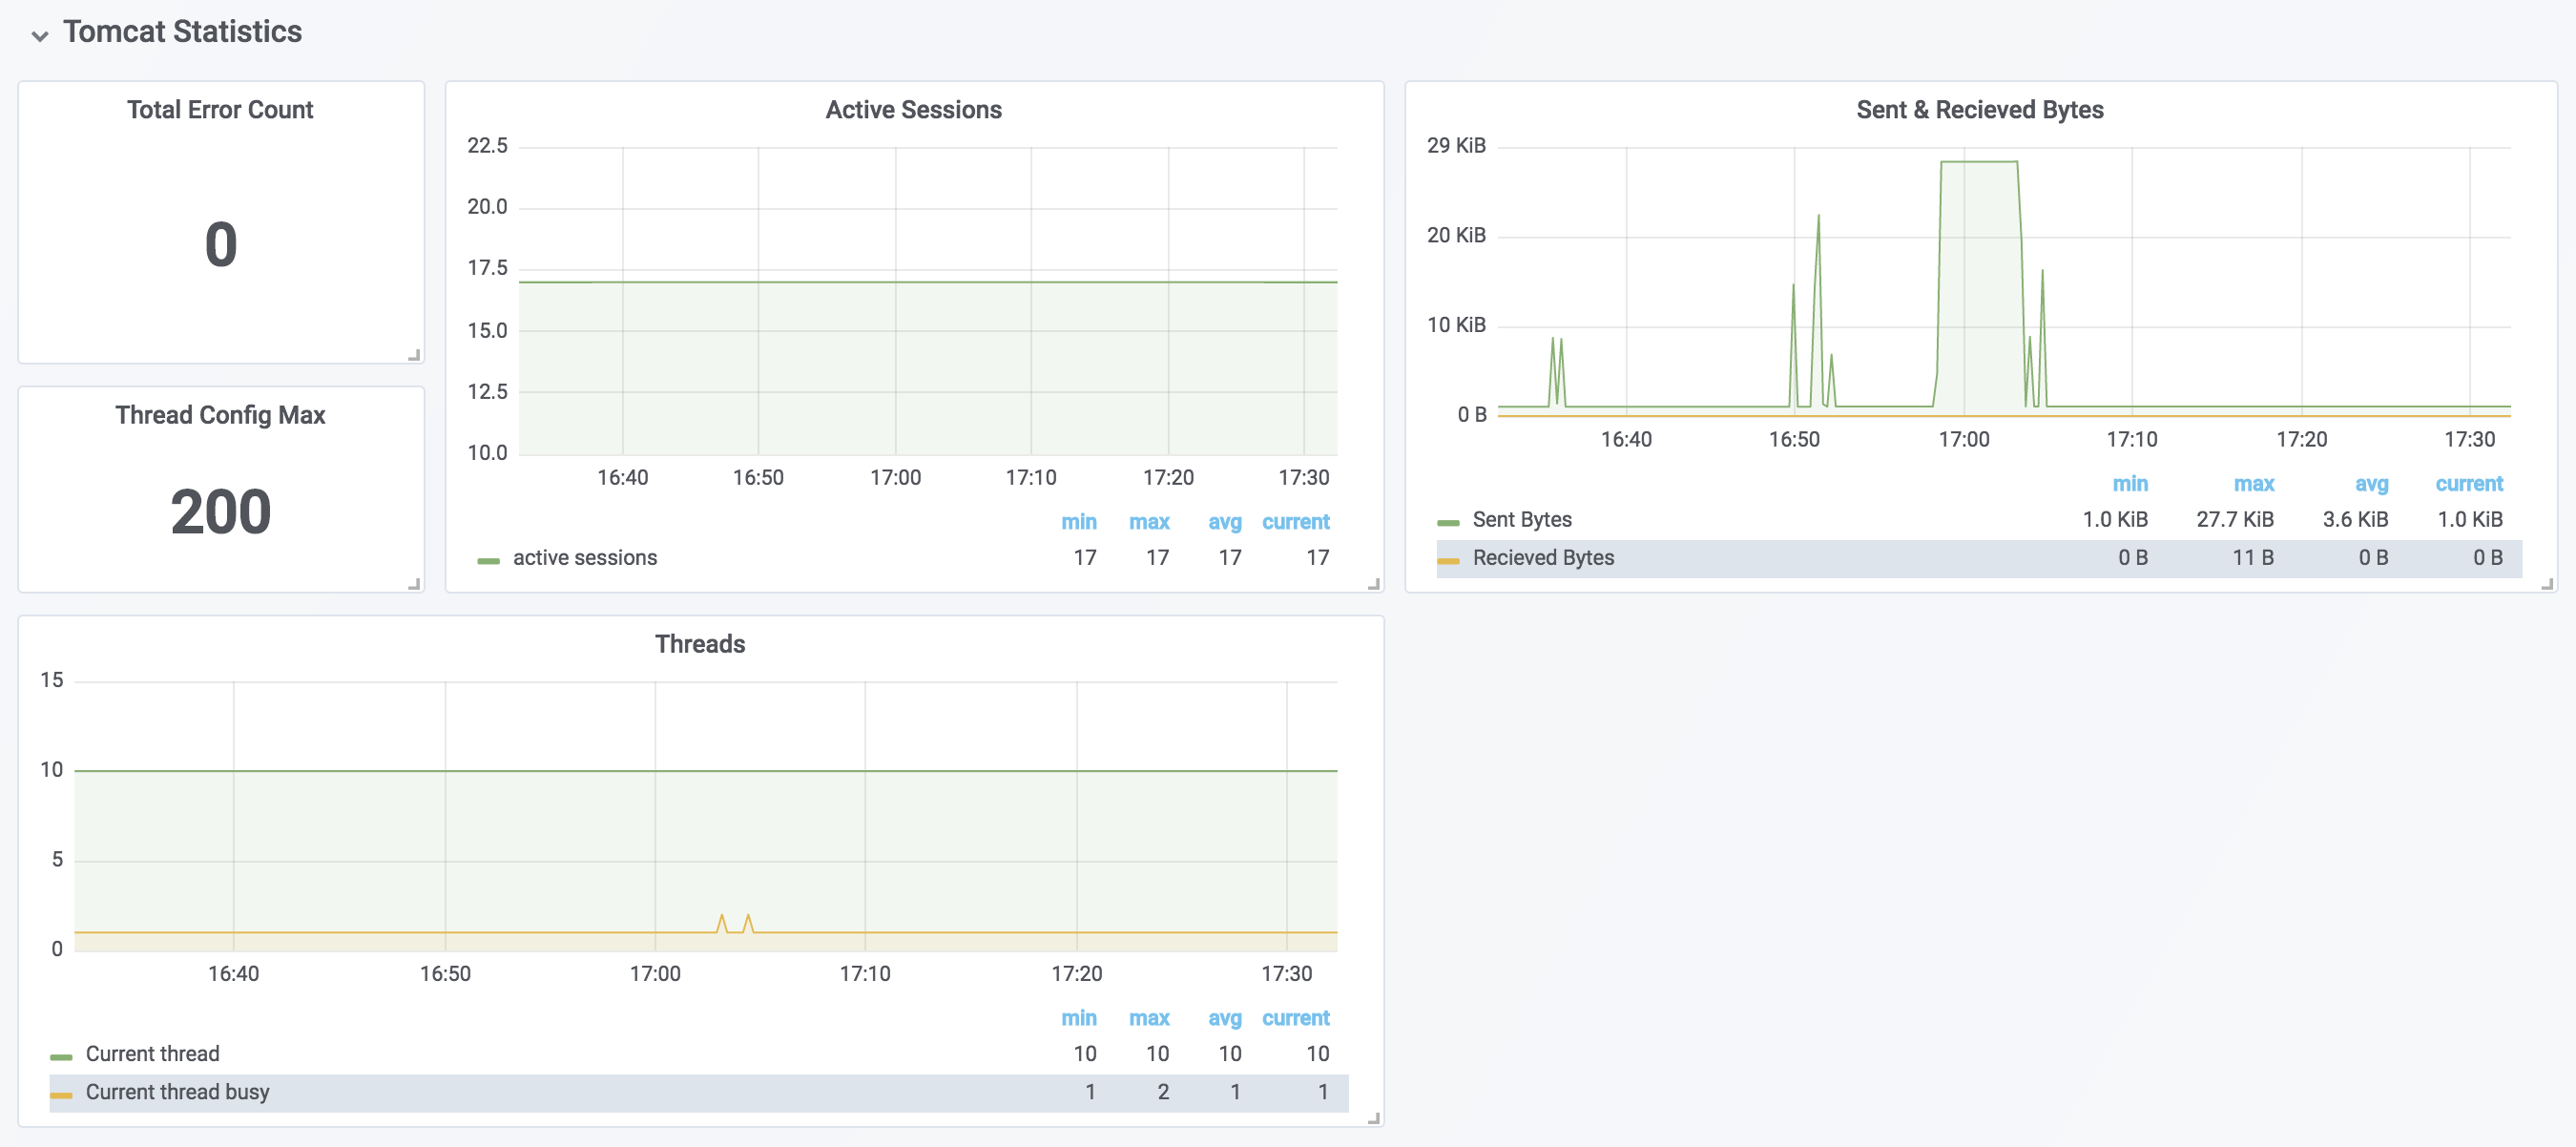
tomcat_global_error_total
tomcat_sessions_active_current
tomcat_global_sent_bytes_total
tomcat_global_received_bytes_total
tomcat_threads_config_max
tomcat_threads_current
tomcat_threads_busy
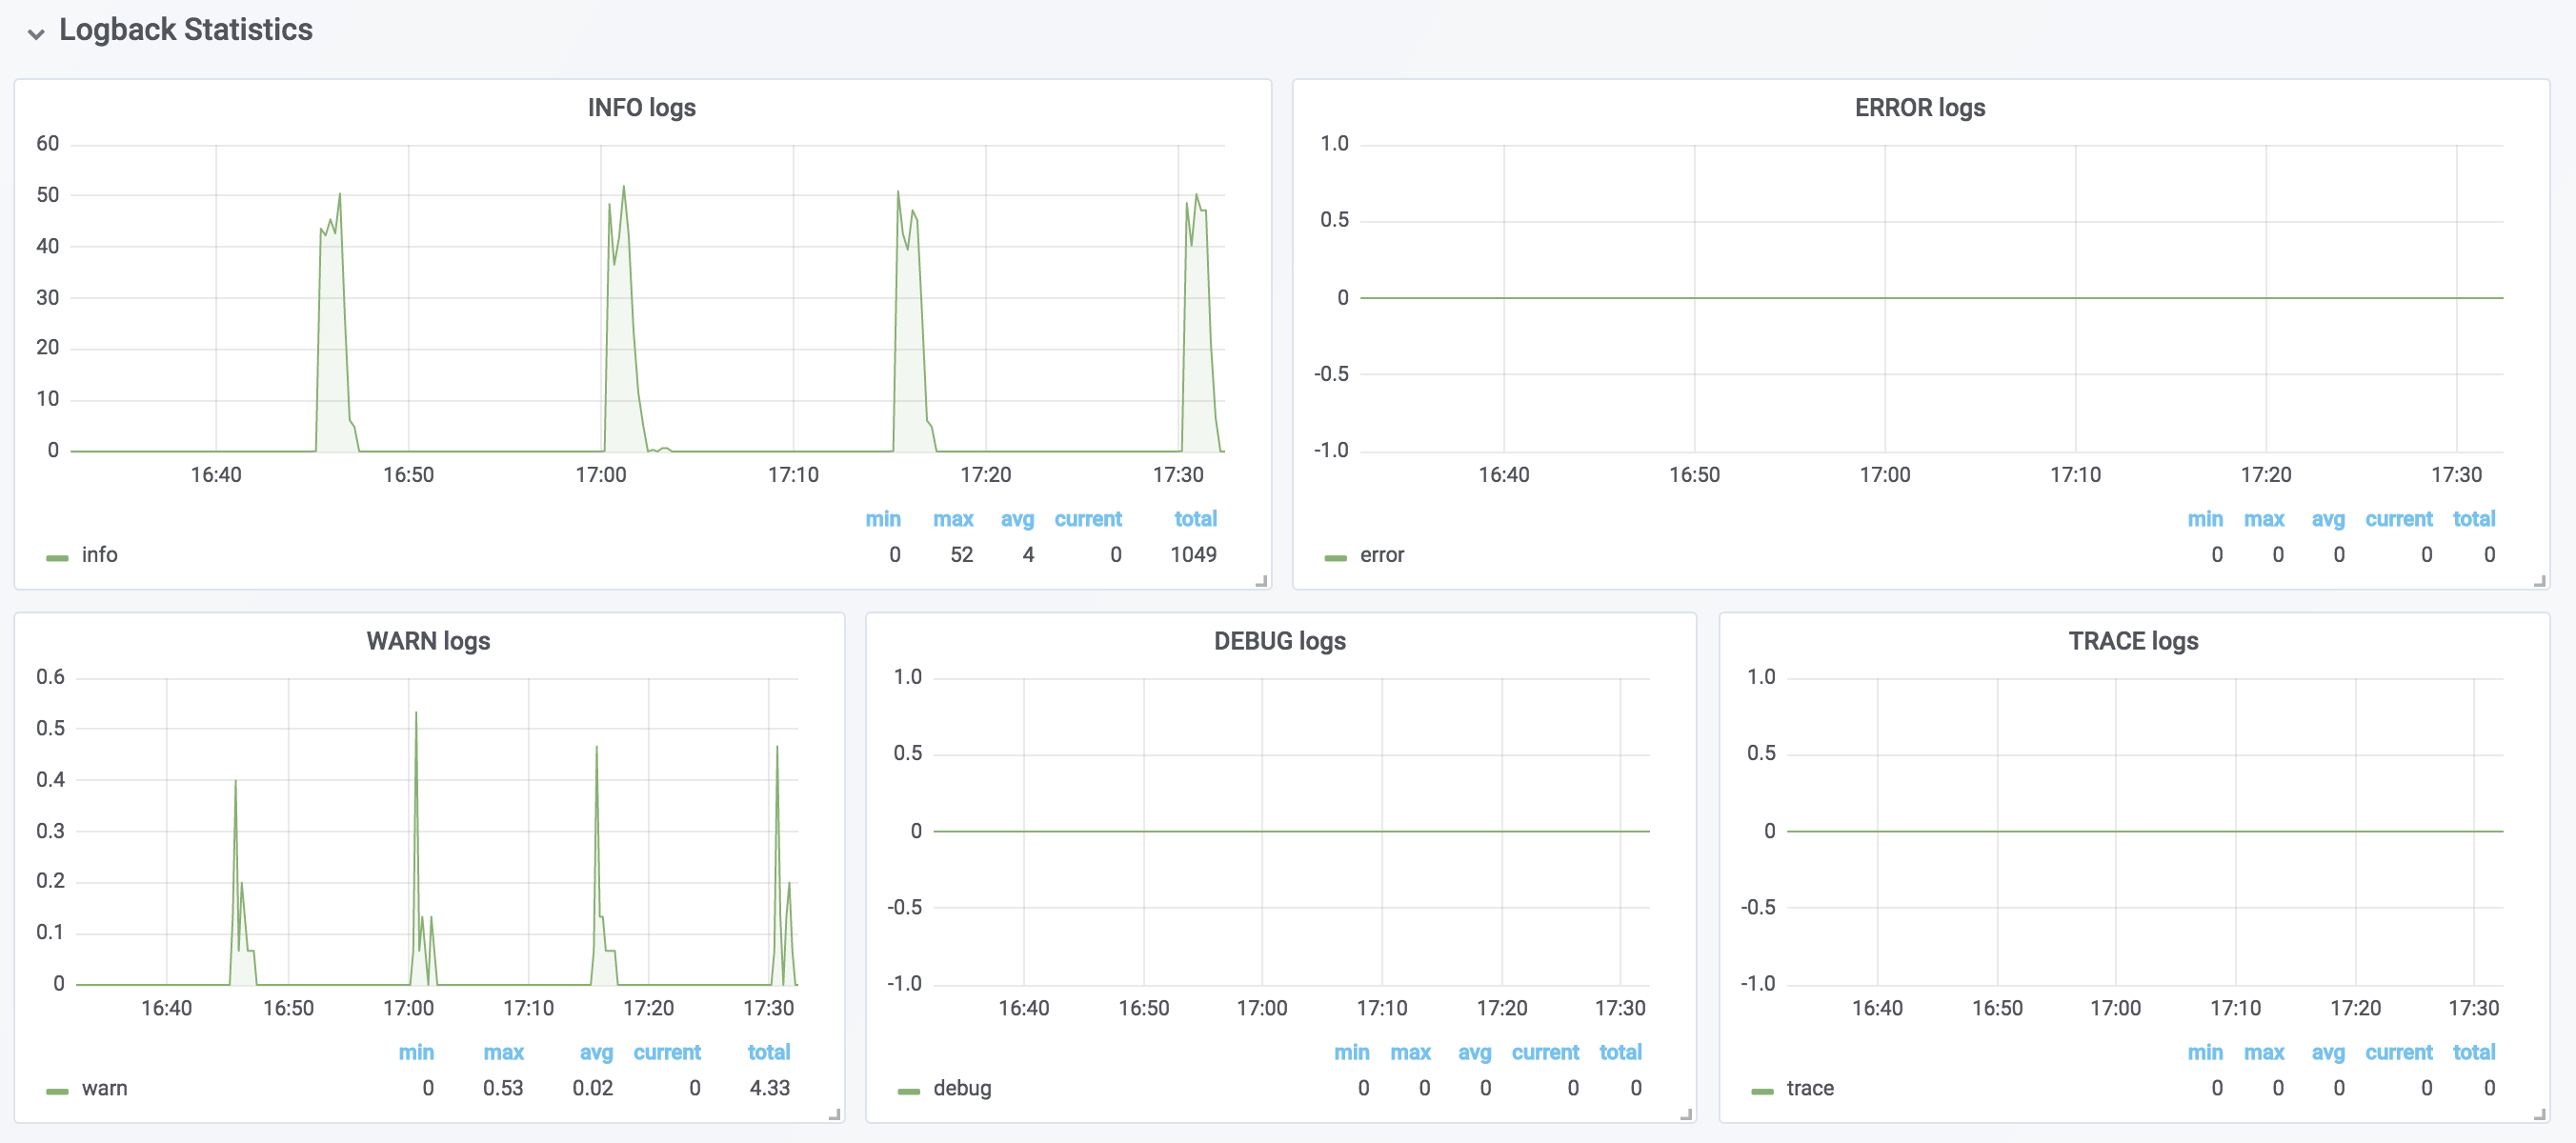
logback_events_total