Ceph Clusters Overview Prometheus 5,5845,584
7/19/2018
7/19/2018
1
>=5.1.4
Prometheus
Description
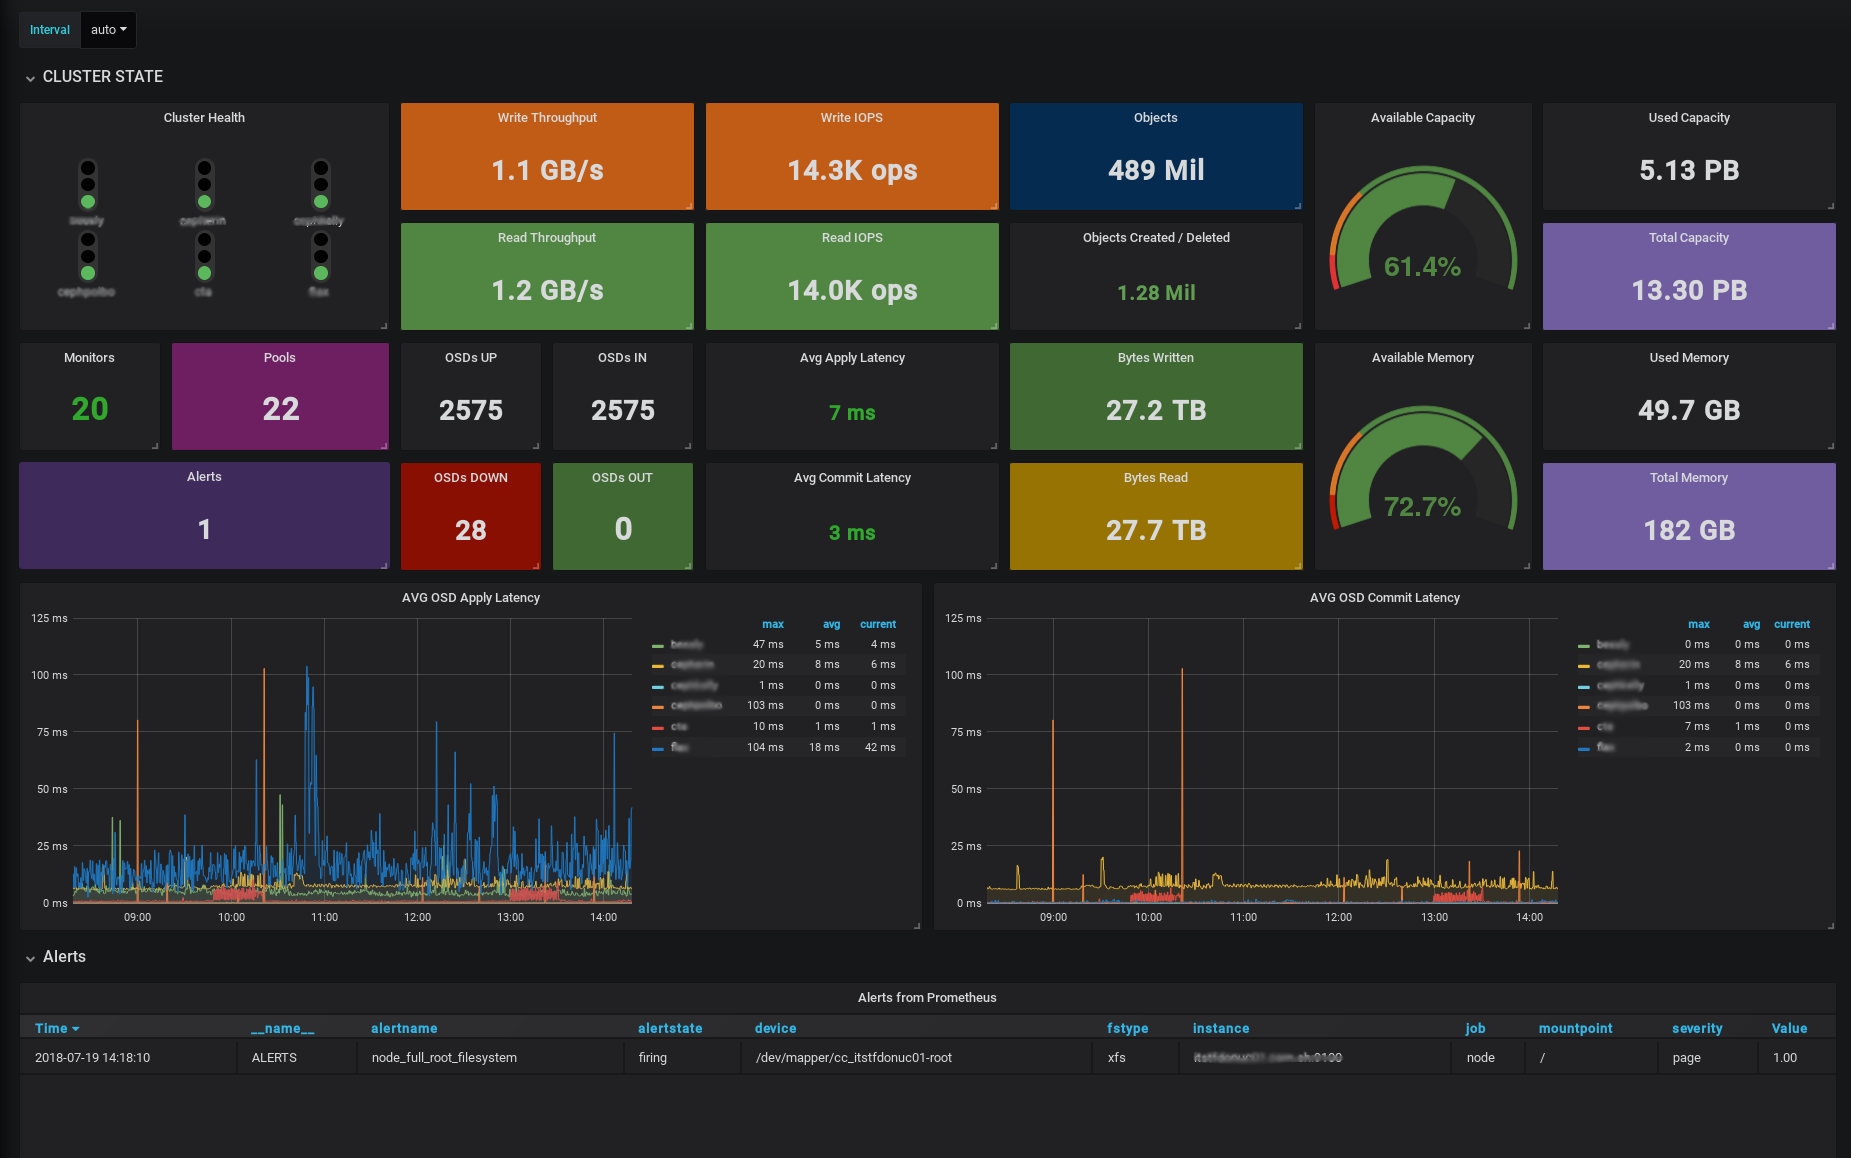
This dashboard is targeted for service managers or teams which manage more than one ceph instances. It shows all the stats combined and also is possible to create comparison graphs between clusters. This dashboard uses native ceph prometheus module (ceph_exporter not needed) for ceph stats and node exporter for node stats
Requisites
- Ceph Luminous (12.2) or Ceph Mimic (13.2)
- Node Exporter for node metrics
Setup
- Enable ceph prometheus module:
ceph mgr module enable prometheus - Allow traffic through the port
9283of the machines containing the ceph mgr. - To ensure that you don't lose the metrics between mgr fail-overs, add all the mgr to the target section in prometheus.
- To allow "by cluster" metrics, create a new label when defining the targets, like:
{
        "targets": [ "mycluster-mgr-1:9283", "mycluster-mgr-2:9283", "mycluster-mgr-3:9283" ],
        "labels": {
           "cluster":"mycluster"
        }
}
Export Dashboard✕
Download
Copy to Clipboard
Used Metrics 1818
-
ceph_health_status
-
ceph_osd_op_w_in_bytes
interval
-
ceph_osd_op_w
ceph_cluster_total_objects
-
ceph_cluster_total_bytes
-
ceph_cluster_total_used_bytes
-
ceph_osd_op_r_out_bytes
-
ceph_osd_op_r
-
ceph_mon_quorum_status
-
ceph_pool_metadata
-
ceph_osd_up
-
ceph_osd_in
-
ceph_osd_apply_latency_ms
-
node_memory_MemTotal_bytes
-
node_memory_Active_bytes
ALERTS
-
ceph_osd_commit_latency_ms