Kubernetes Cluster 687,087687,087 5.0 (5 reviews)
7/30/2018
7/30/2018
1
AWSDocker
>=5.2.0
Prometheus
Updated from https://grafana.com/dashboards/4018 for use with
- Kubernetes v1.10.~
- Prometheus v2.3.1
- Prometheus Node Exporter v0.16.0
- Nginx Ingress Controller 0.15.0
- Kube State Metrics v1.3.1
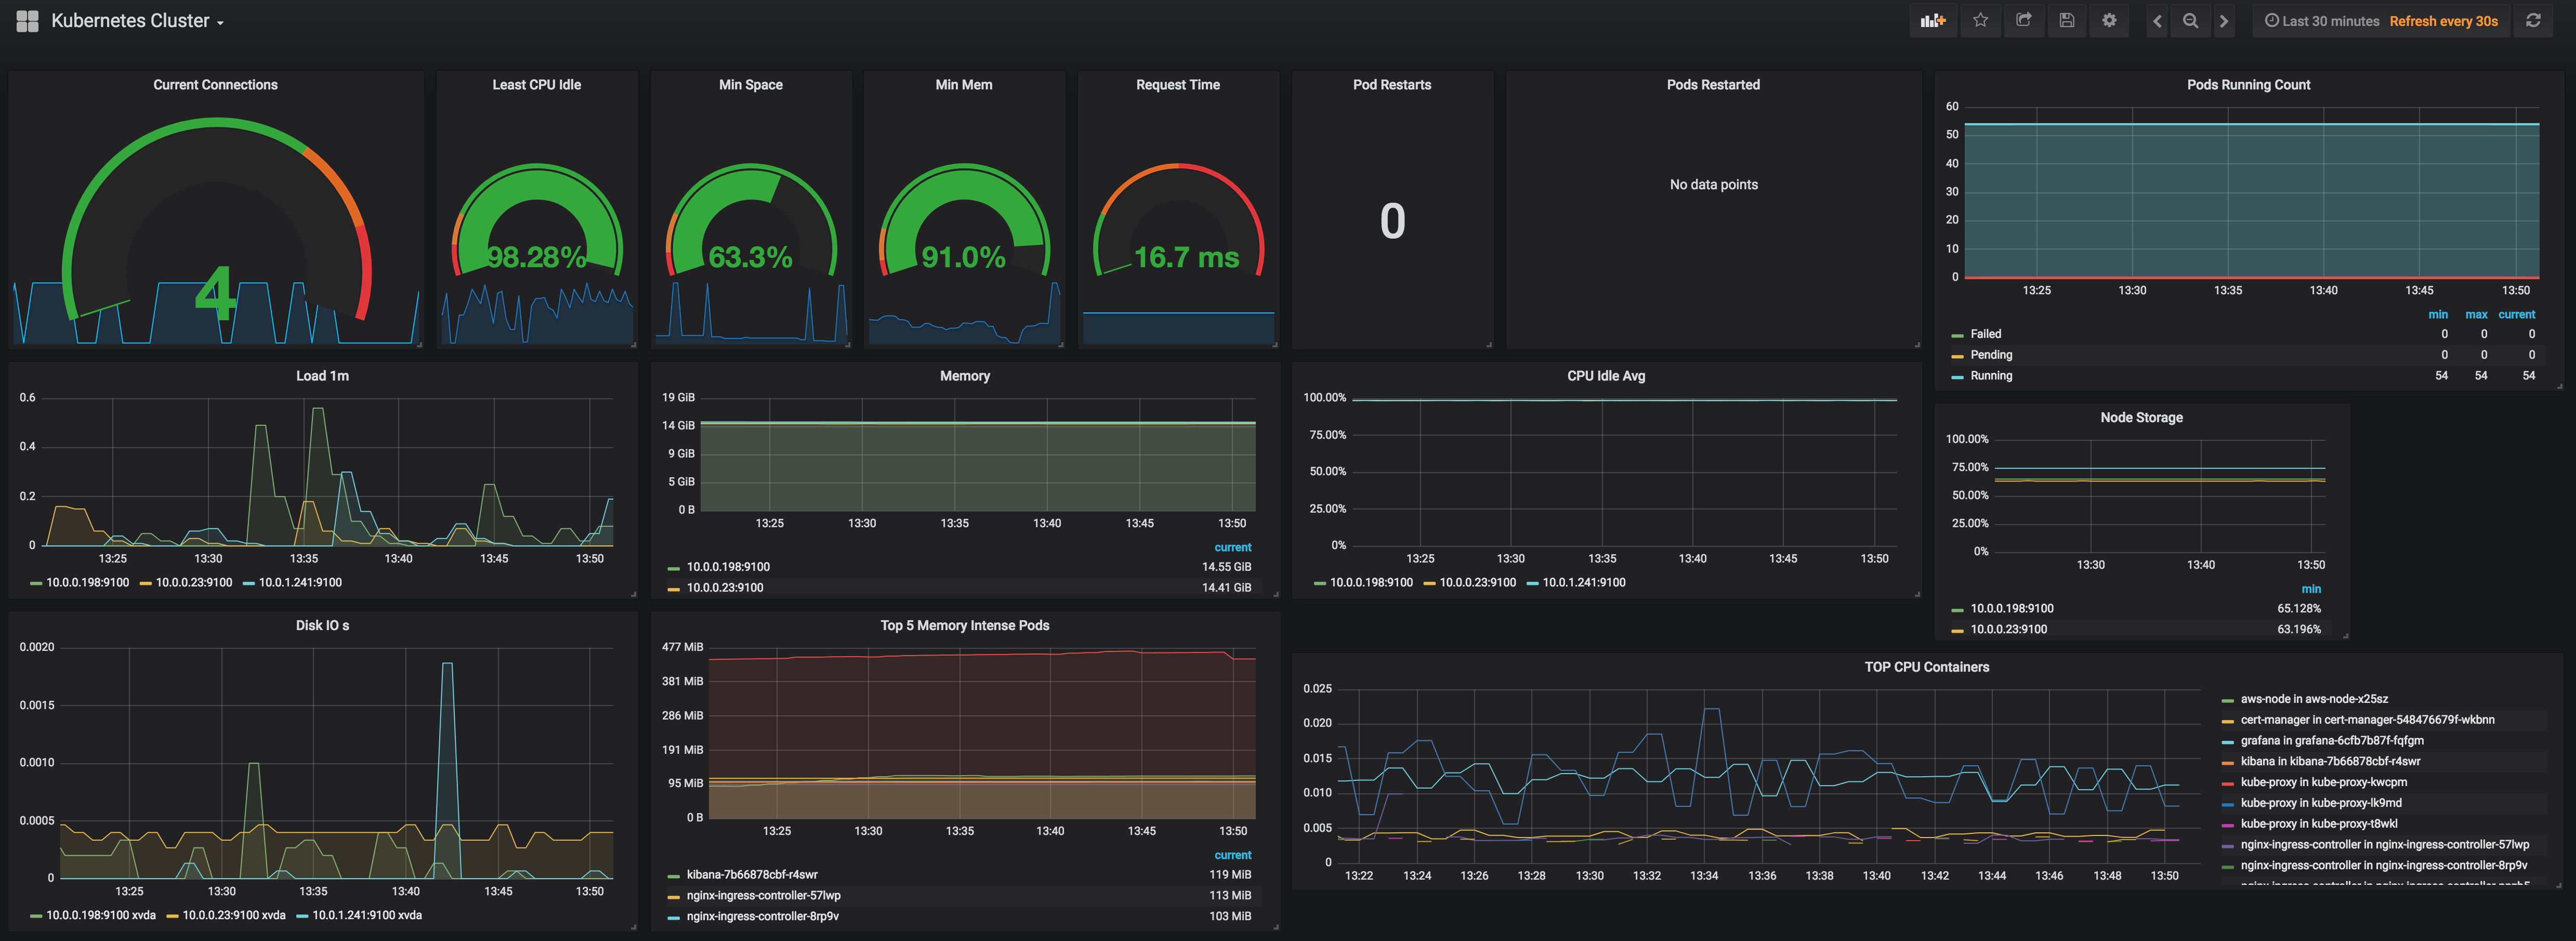
Shows basic stuff about
- cluster health (pod status count, pod restarts etc.)
- cluster nodes (cpu, memory, storage etc.)
- running pods (cpu, memory etc.)
- nginx ingress controller (connections, resp time)
intended for a starting point for looking at and debugging cluster health / performance
Export Dashboard✕
Download
Copy to Clipboard
Used Metrics 1919
nginx_connections_total
min
-
node_cpu_seconds_total
-
node_filesystem_avail_bytes
-
node_filesystem_size_bytes
-
node_memory_MemAvailable_bytes
-
node_memory_MemTotal_bytes
http_request_duration_seconds_count
kube_pod_container_status_restarts_total
kube_pod_status_phase
kubelet_running_pod_count
-
node_load1
-
node_memory_MemFree_bytes
-
node_memory_Buffers_bytes
-
node_memory_Cached_bytes
-
node_disk_io_time_seconds_total
topk
-
container_memory_usage_bytes
-
container_cpu_usage_seconds_total