JVM dashboard 28,88928,889 4.2 (6 reviews)
Gist is here
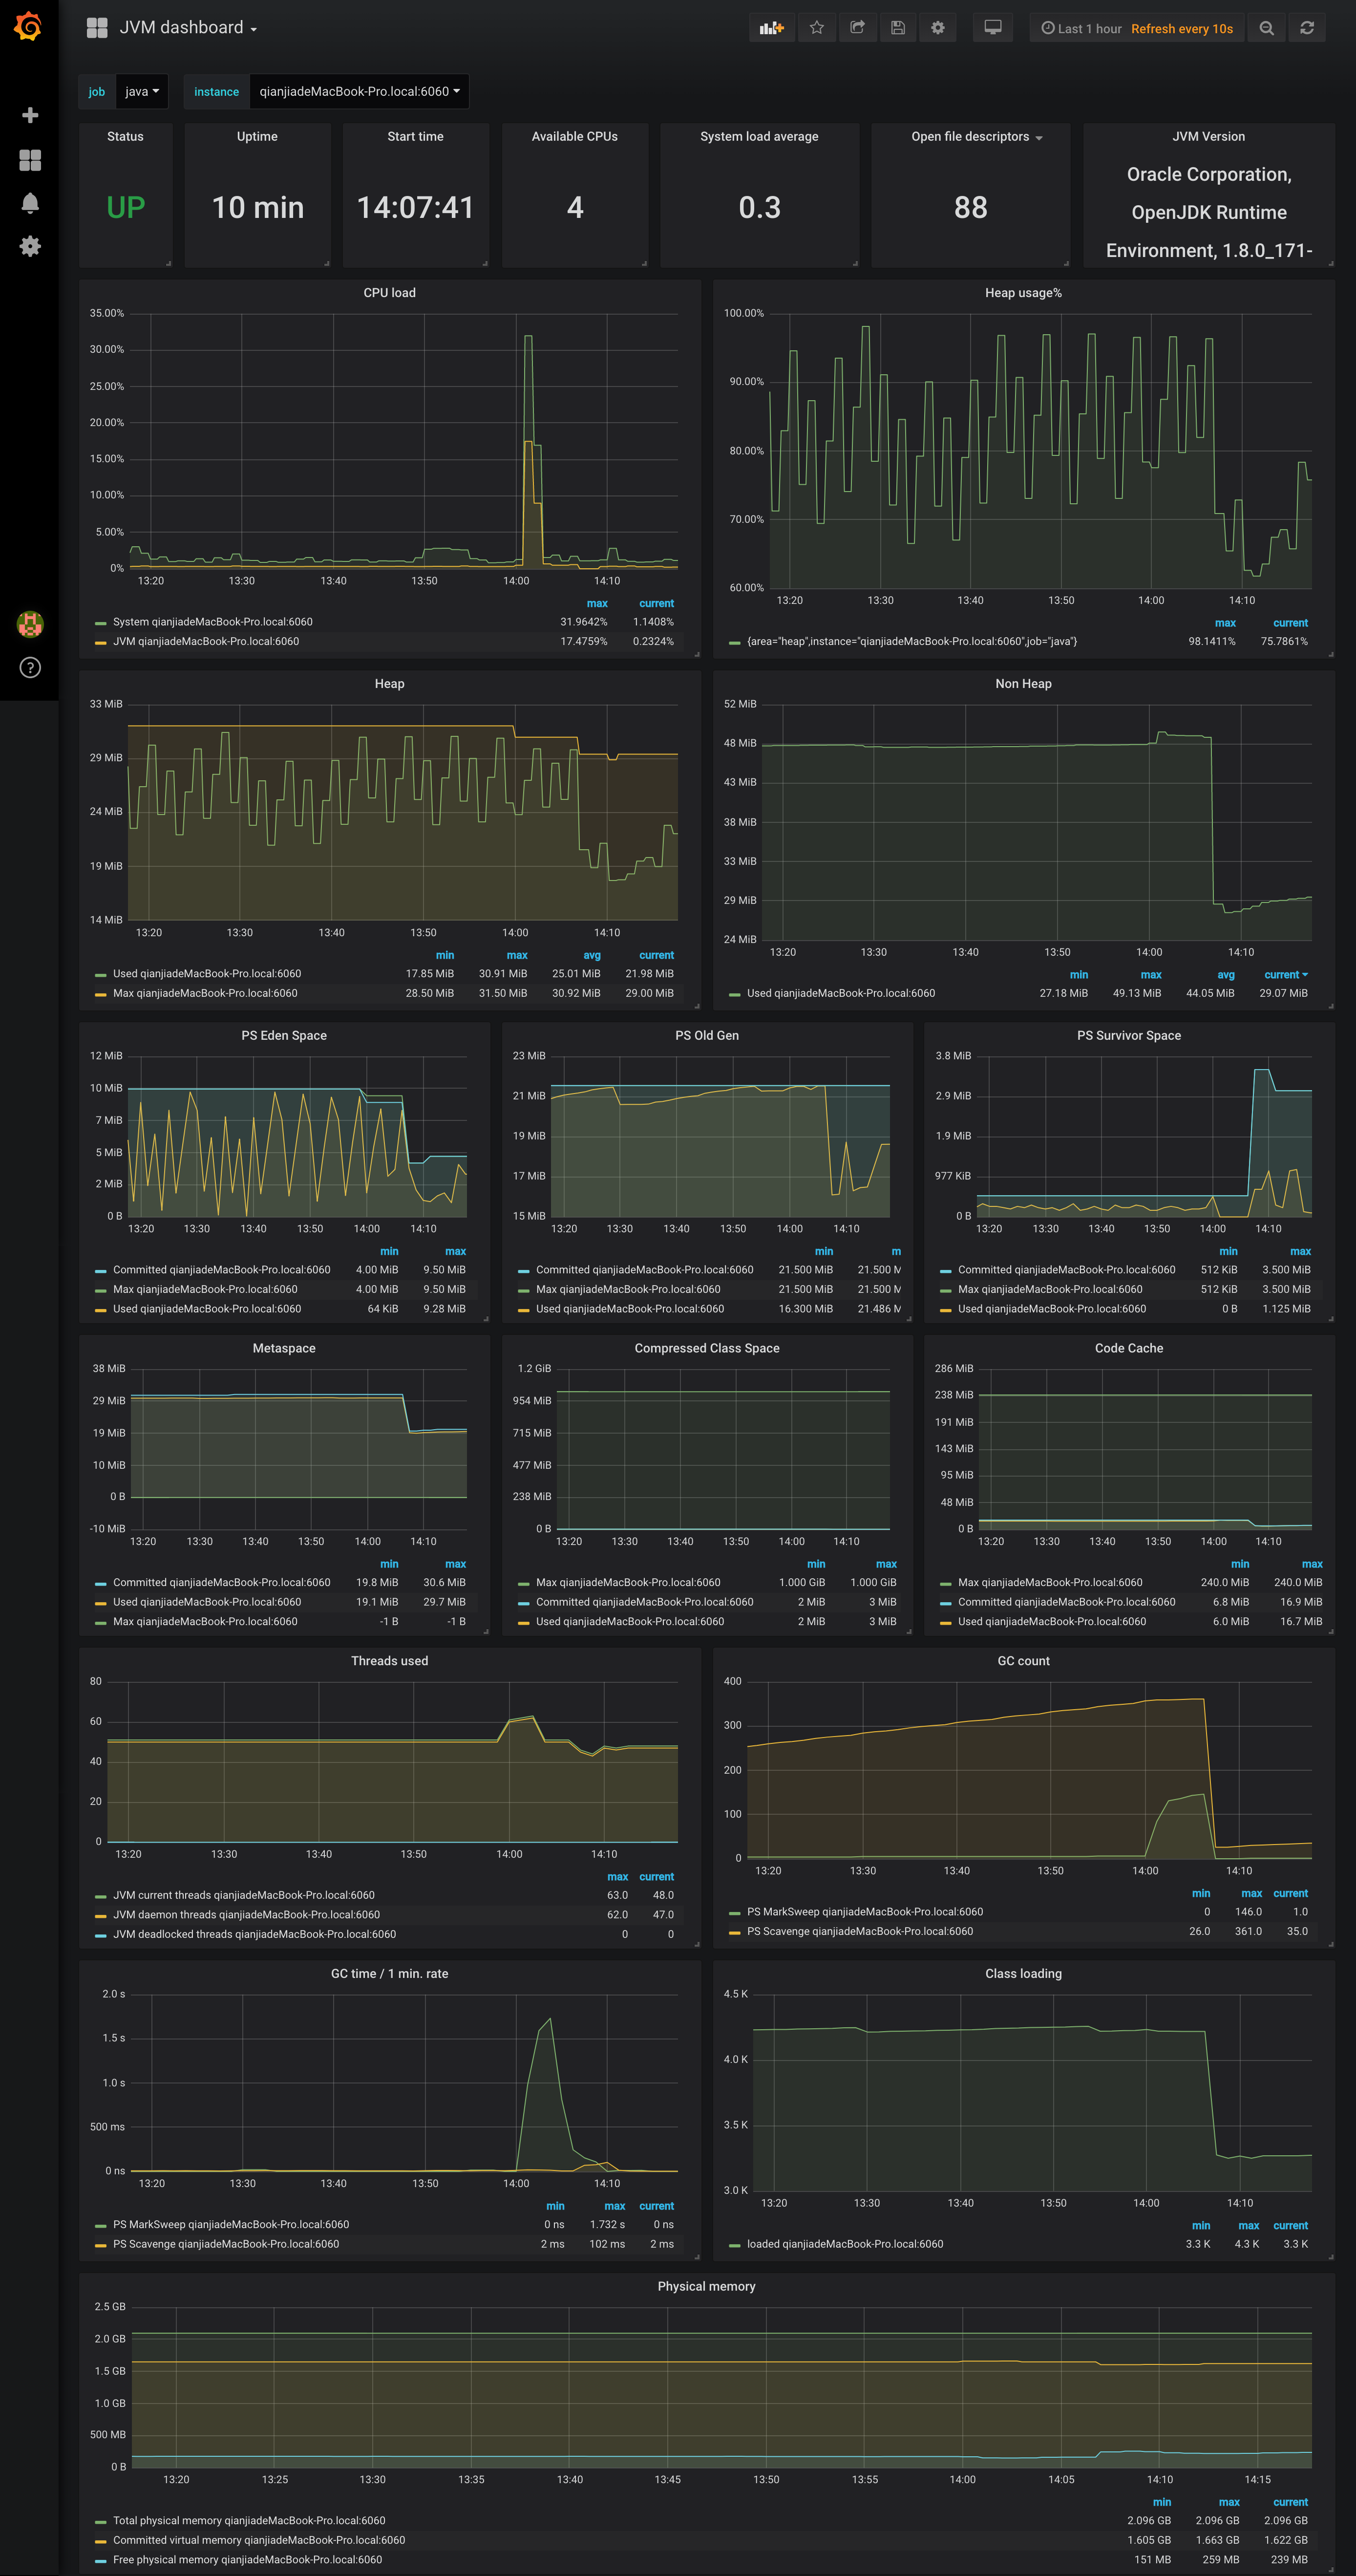
Based on JMX exporter prometheus.
Dashboard for jvm_* metrics which are exported by JMX exporter.
Prometheus with config example:
scrape_configs:
  - job_name: 'java'
    static_configs:
    - targets: ['<host>:<port>']
You can change config file's job_name and dashboard's job constant variable correspondingly.
jmx-exporter config example:
---
lowercaseOutputLabelNames: true
lowercaseOutputName: true
whitelistObjectNames: ["java.lang:type=OperatingSystem"]
blacklistObjectNames: []
rules:
  - pattern: 'java.lang<type=OperatingSystem><>(committed_virtual_memory|free_physical_memory|free_swap_space|total_physical_memory|total_swap_space)_size:'
    name: os_$1_bytes
    type: GAUGE
    attrNameSnakeCase: true
  - pattern: 'java.lang<type=OperatingSystem><>((?!process_cpu_time)\w+):'
    name: os_$1
    type: GAUGE
    attrNameSnakeCase: true
Used Metrics 2626
-
up
-
process_start_time_seconds
jvm_info
jdk
vendor
runtime
version
os_available_processors
os_system_load_average
os_open_file_descriptor_count
os_system_cpu_load
os_process_cpu_load
jvm_memory_bytes_used
jvm_memory_bytes_max
jvm_gc_collection_seconds_sum
jvm_memory_pool_bytes_max
jvm_memory_pool_bytes_used
jvm_memory_pool_bytes_committed
jvm_classes_loaded
jvm_gc_collection_seconds_count
jvm_threads_current
jvm_threads_daemon
jvm_threads_deadlocked
os_total_physical_memory_bytes
os_committed_virtual_memory_bytes
os_free_physical_memory_bytes