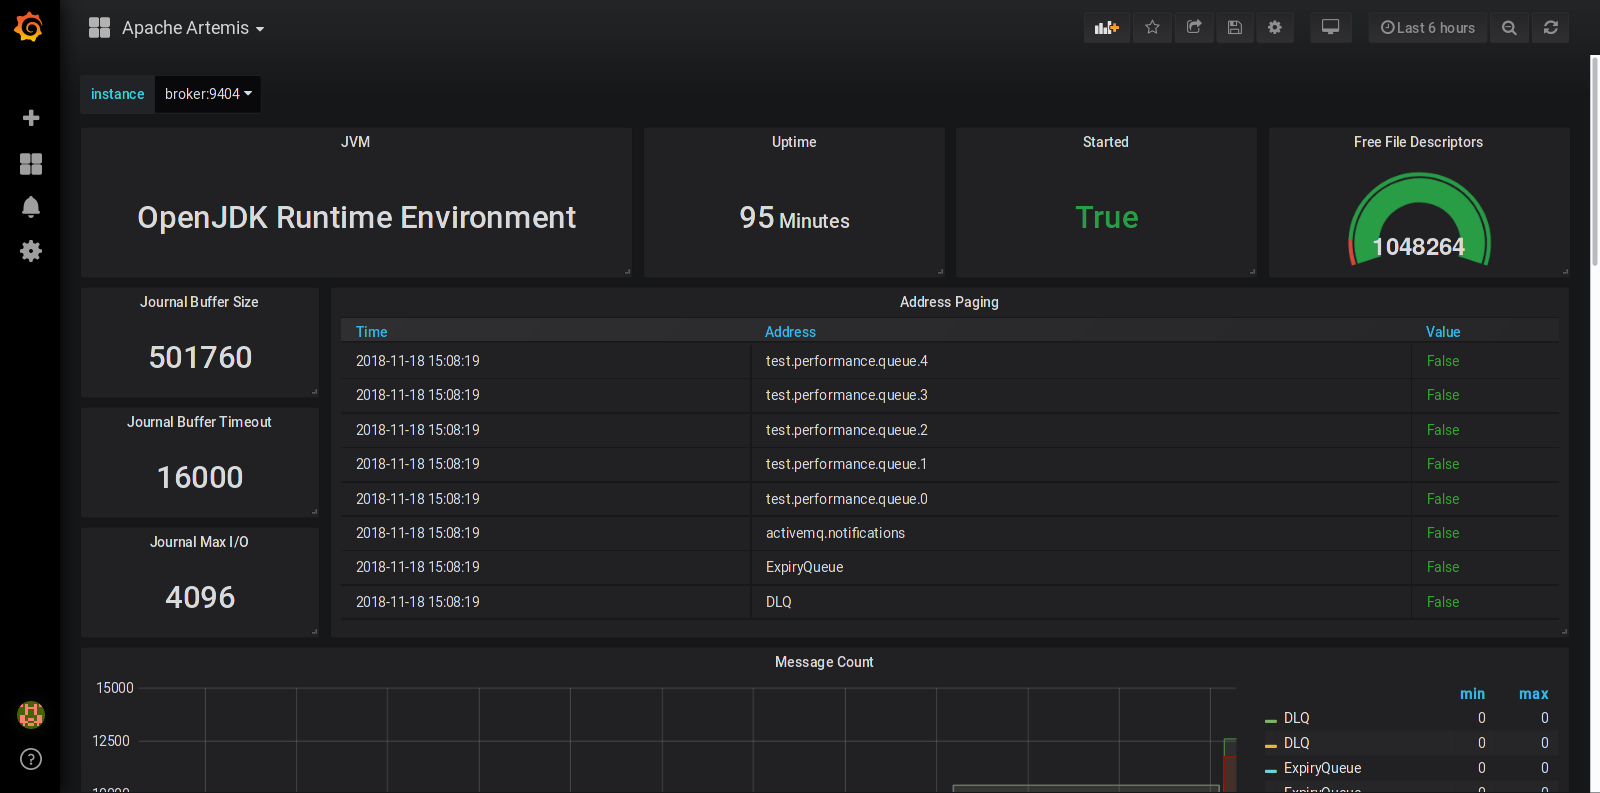
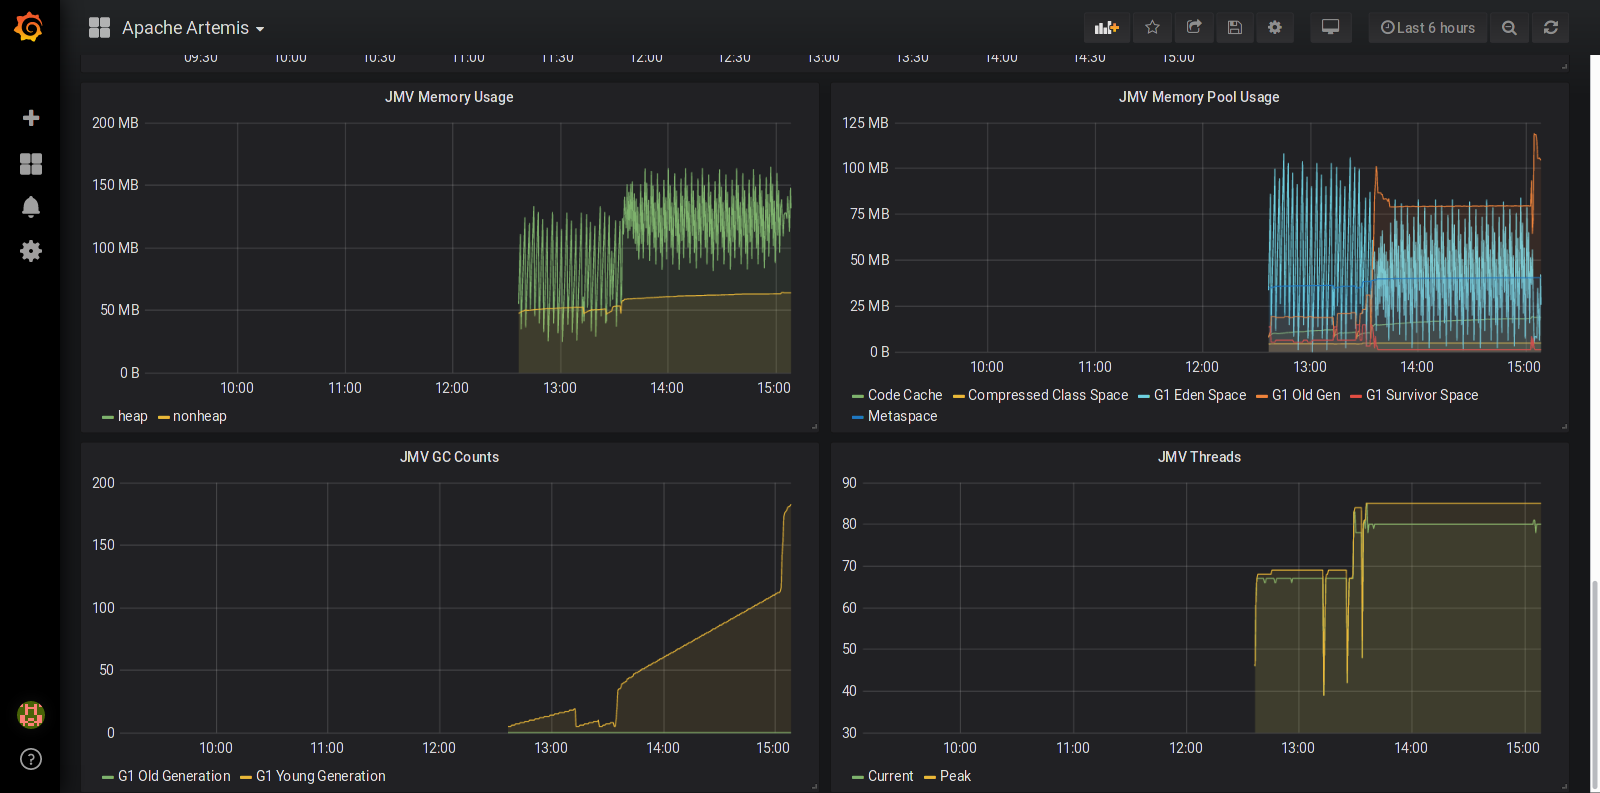
Apache Artemis 1,8951,895
11/18/2018
11/18/2018
1
>=5.3.4
Prometheus
This dashboard requires the Artemis broker to be configured with the Prometheus JMX Exporter. Once the dashboard is imported, you have to set the instance variable on the dashboard to point to the exporter instance. A sample demonstration project using this dashboard is also available for download.
If you have questions, feel free to send me a message on Twitter.
Export Dashboard✕
Download
Copy to Clipboard

Used Metrics 1818
jvm_info
artemis_uptime_millis
artemis_started
-
process_max_fds
-
process_open_fds
artemis_journal_buffer_size
artemis_paging
artemis_journal_buffer_timeout
artemis_journal_max_io
artemis_message_count
artemis_connection_count
artemis_consumer_count
artemis_address_size
jvm_memory_bytes_used
jvm_memory_pool_bytes_used
jvm_gc_collection_seconds_count
jvm_threads_current
jvm_threads_peak
