AAA Postgres_exporter 104,129104,129
Description
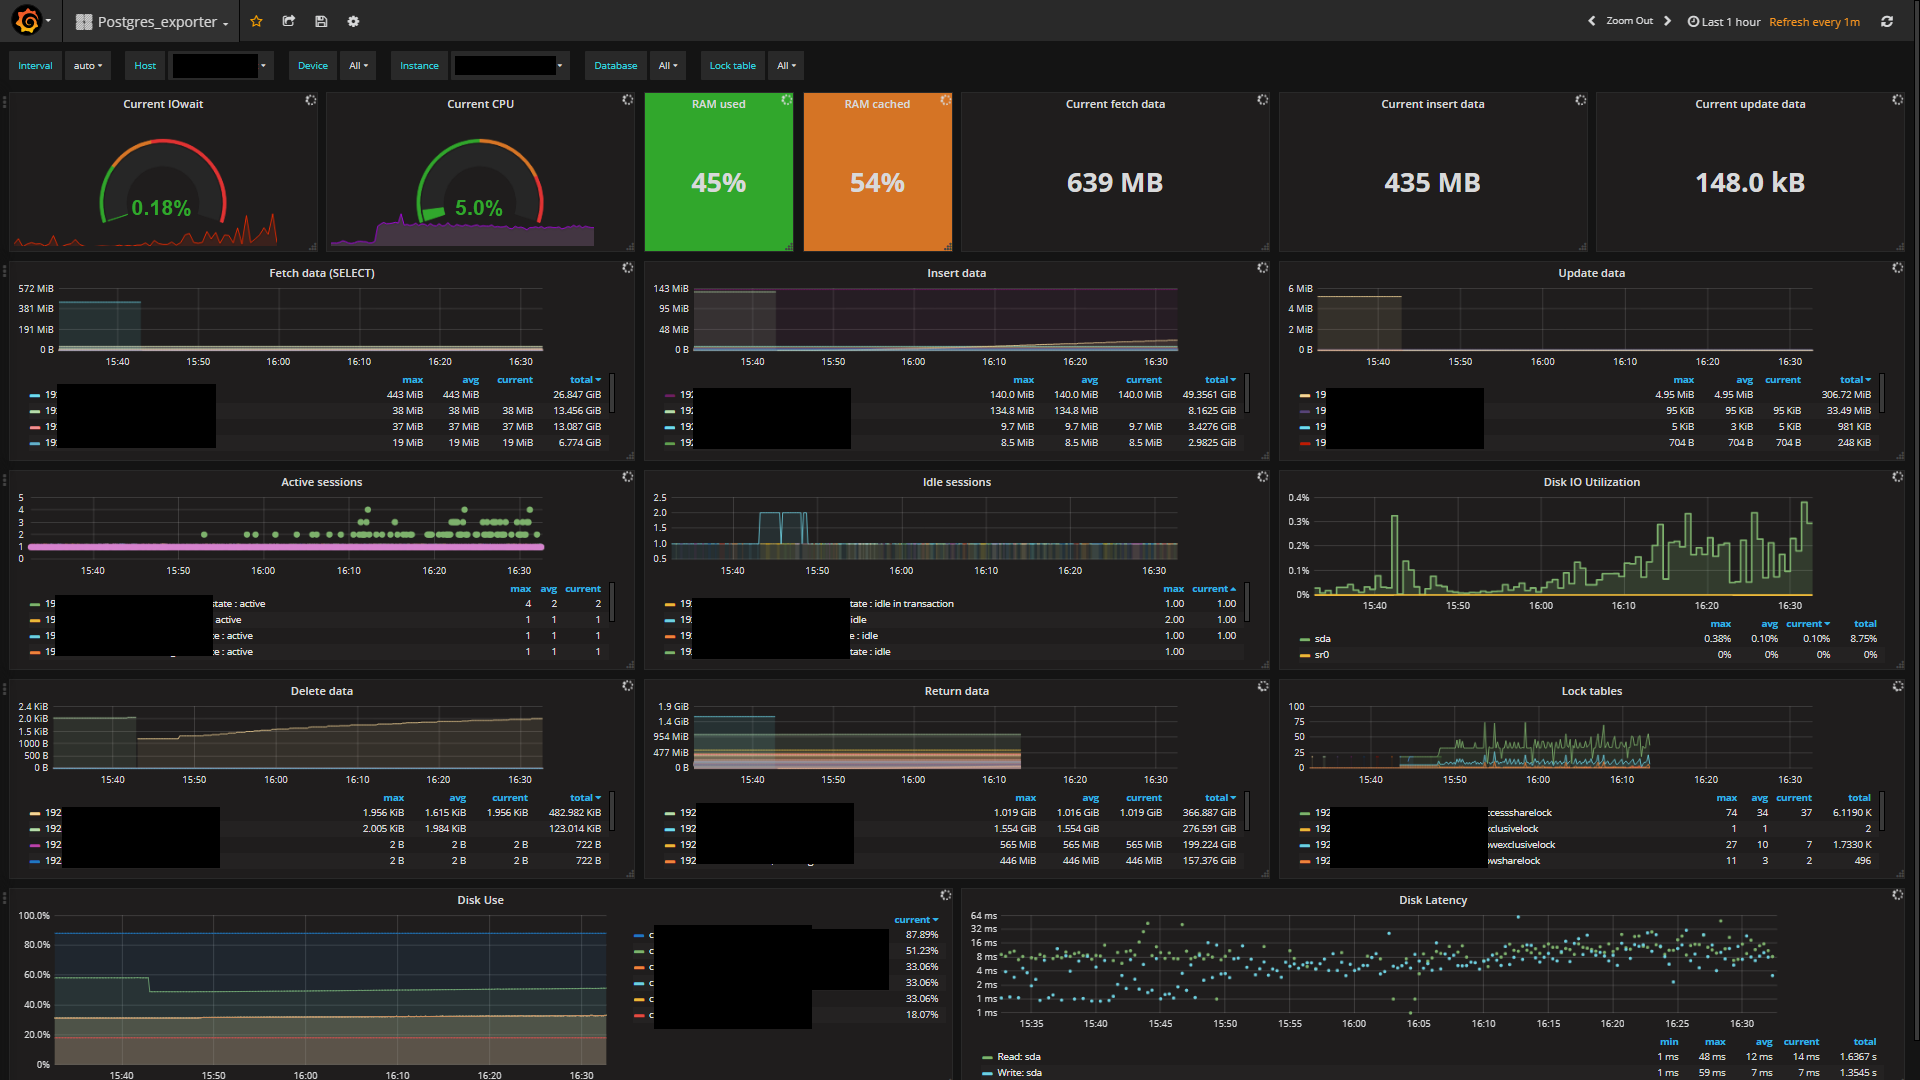
This dashboard monitors PostgreSQL performance and system resources by combining host-level metrics with database activity via node_cpu, node_memory_*, and pg_stat_* metrics. It highlights real-time IO, CPU, and memory usage alongside query load and contention, with panels such as Current IOwait, Current CPU, and Active sessions to quickly diagnose bottlenecks. It also tracks row-level activity like pg_stat_database_tup_fetched, pg_stat_database_tup_inserted, and pg_stat_database_tup_updated, as well as disk throughput and latency through panels like Disk IO Utilization and Disk Latency. Configurable thresholds and time range selections enable rapid drift detection and historical comparisons.
Screenshots
Used Metrics 2020
interval
node_cpu
node_disk_io_time_ms
node_disk_read_time_ms
node_disk_reads_completed
node_disk_write_time_ms
node_disk_writes_completed
node_filesystem_free
node_filesystem_size
node_memory_Buffers
node_memory_Cached
node_memory_MemFree
node_memory_MemTotal
-
pg_locks_count
-
pg_stat_activity_count
-
pg_stat_database_tup_deleted
-
pg_stat_database_tup_fetched
-
pg_stat_database_tup_inserted
-
pg_stat_database_tup_returned
-
pg_stat_database_tup_updated