Alertmanager 19,343,72219,343,722 4.0 (2 reviews)
Description
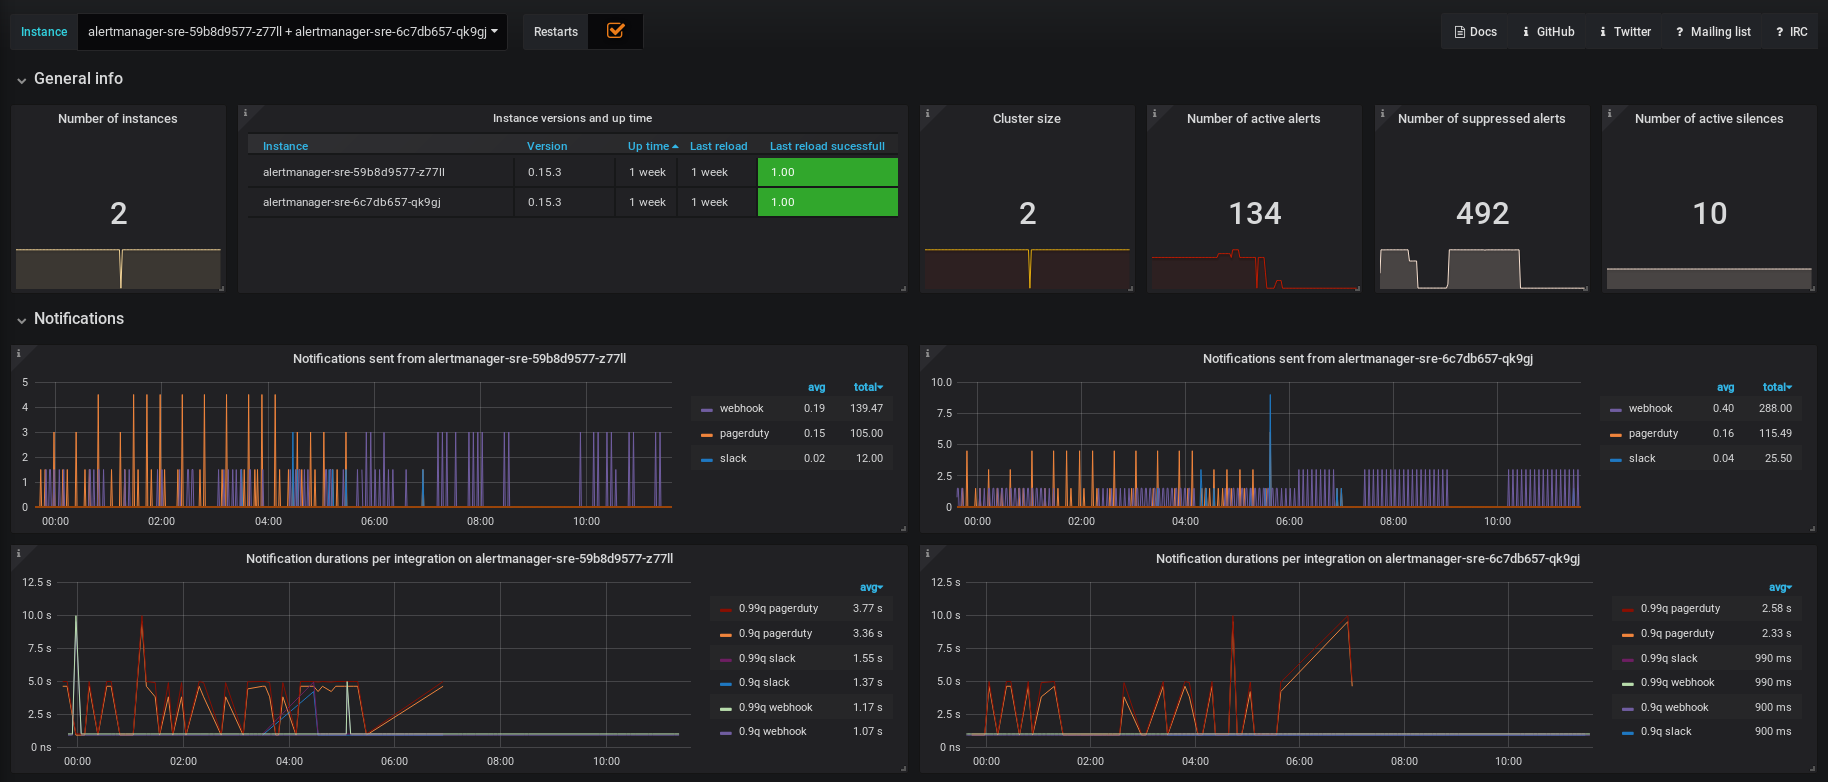
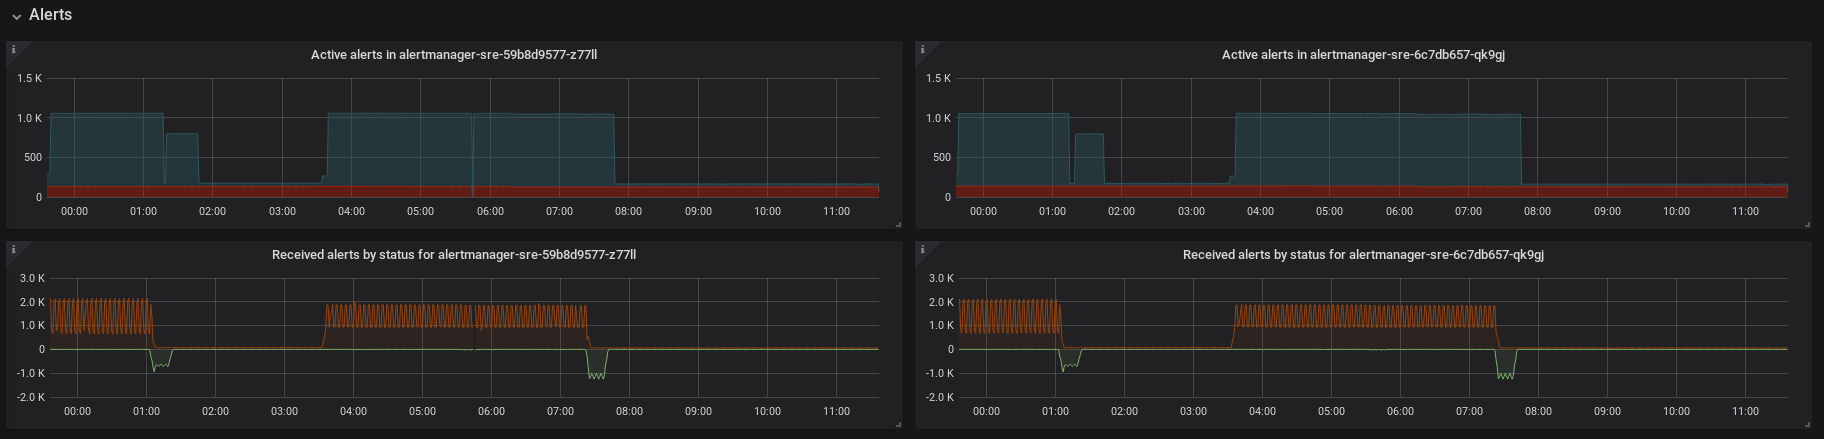
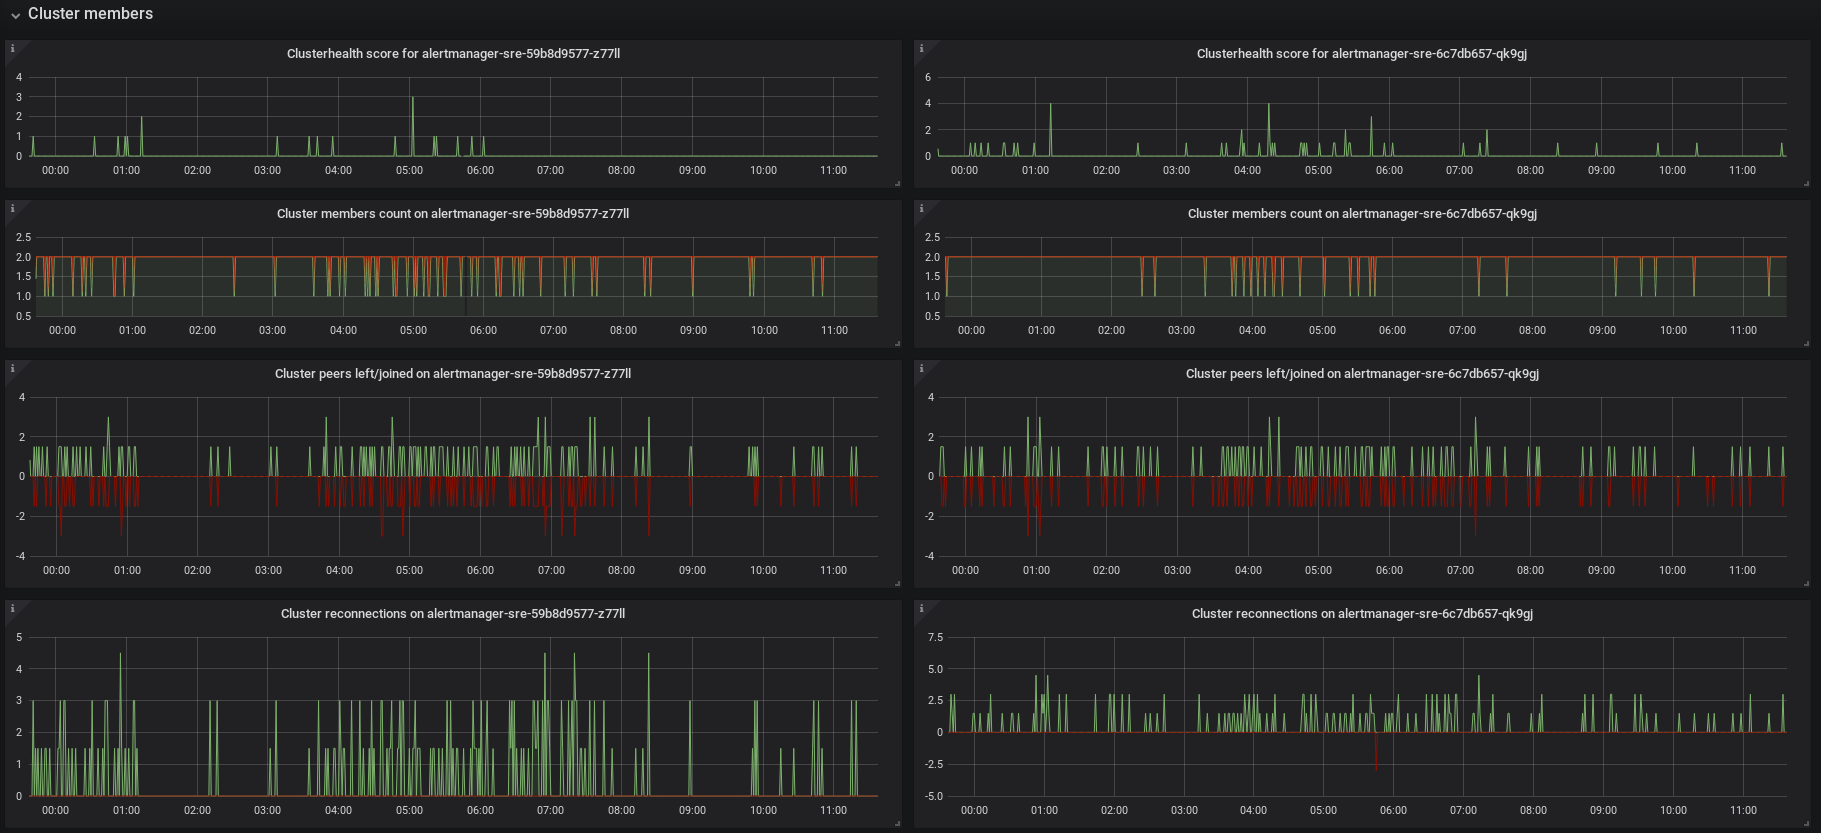
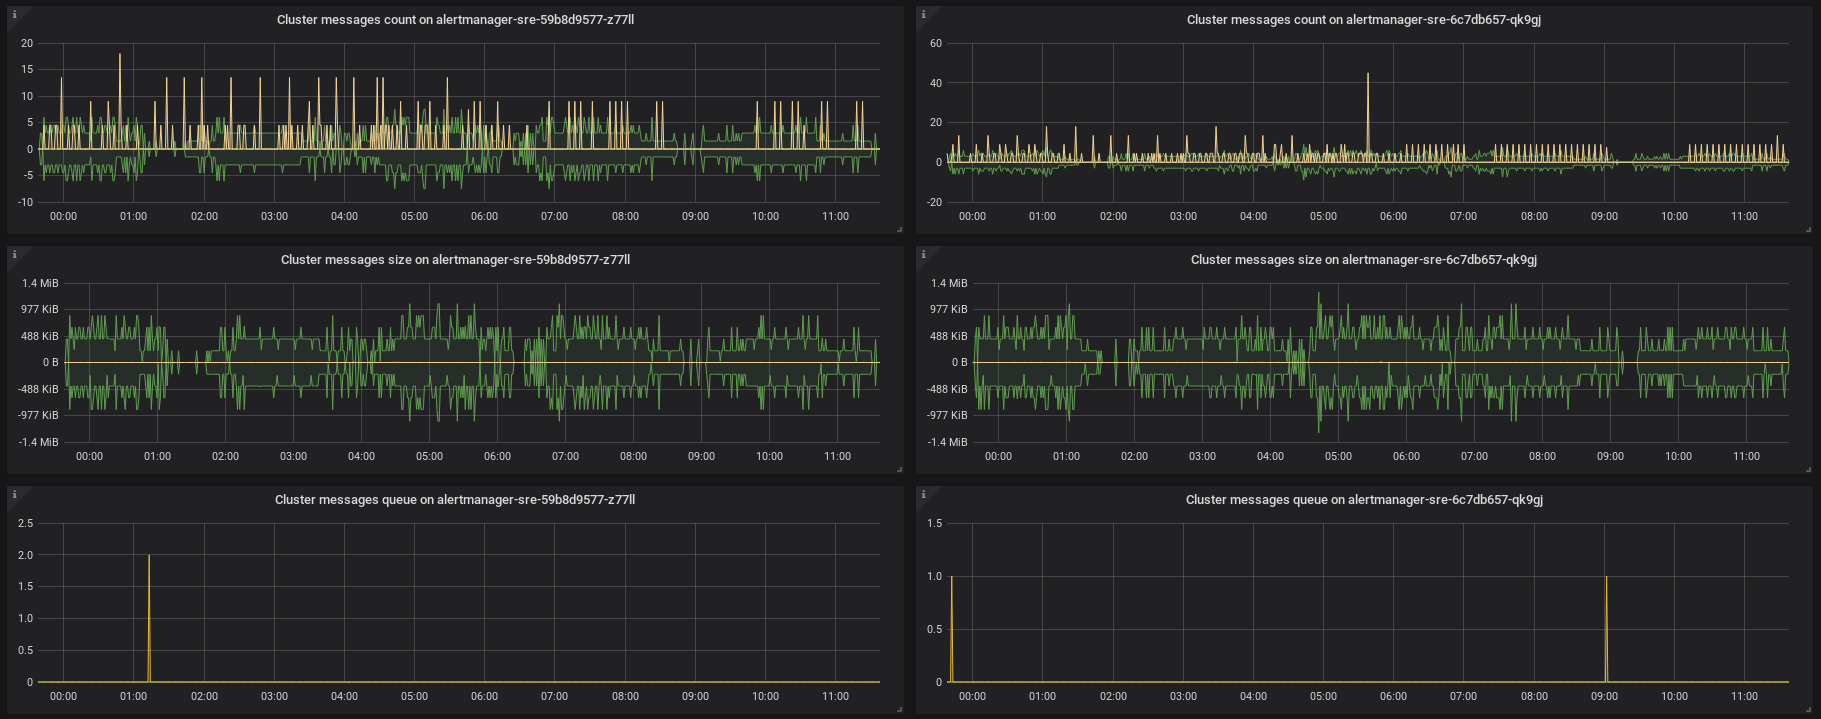
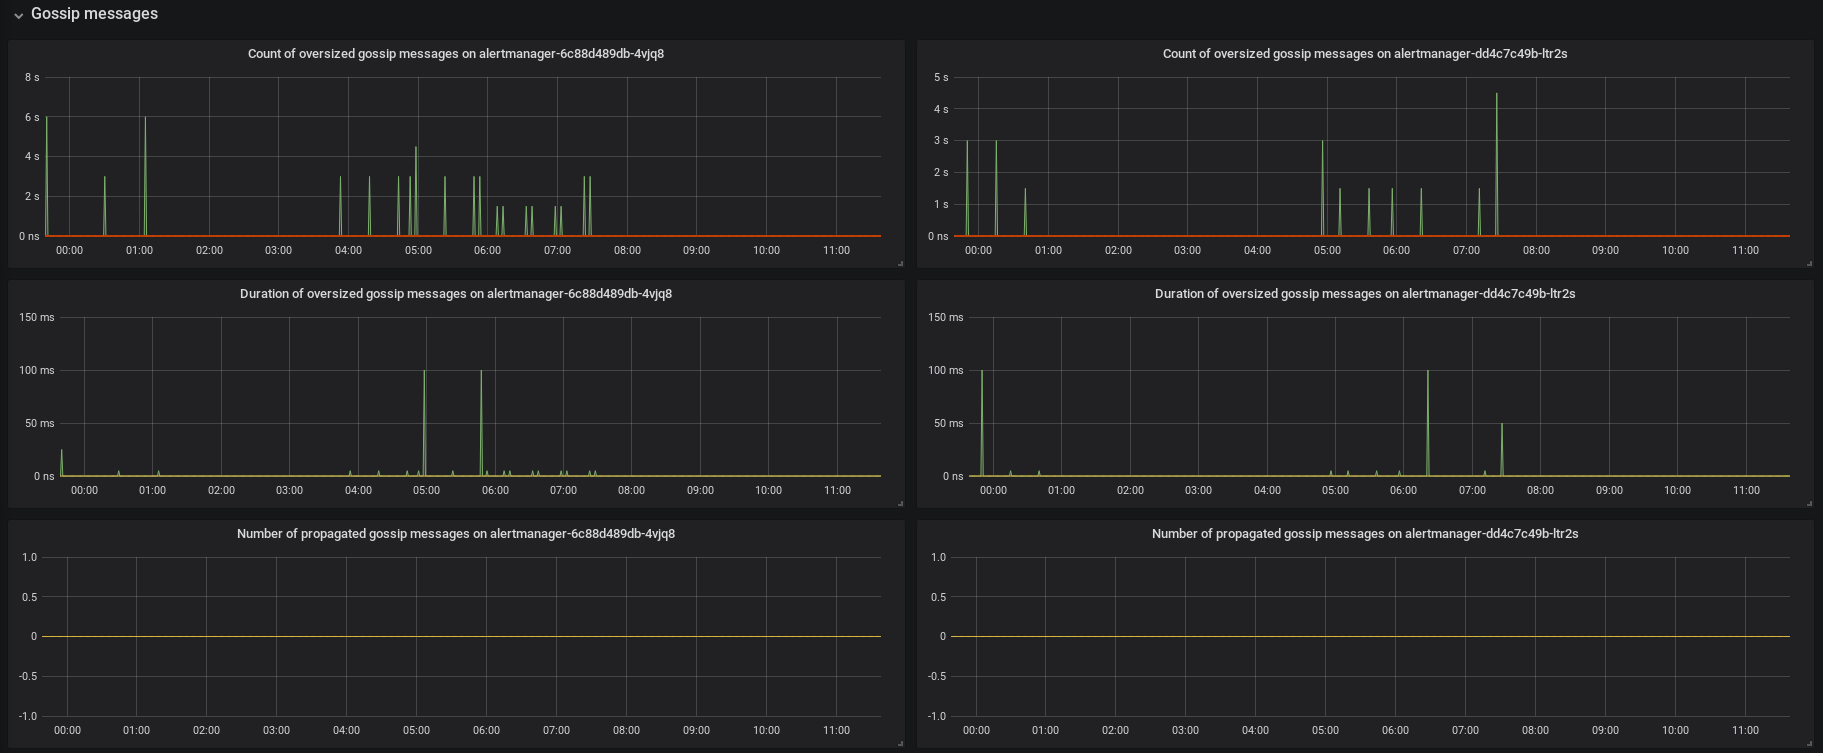
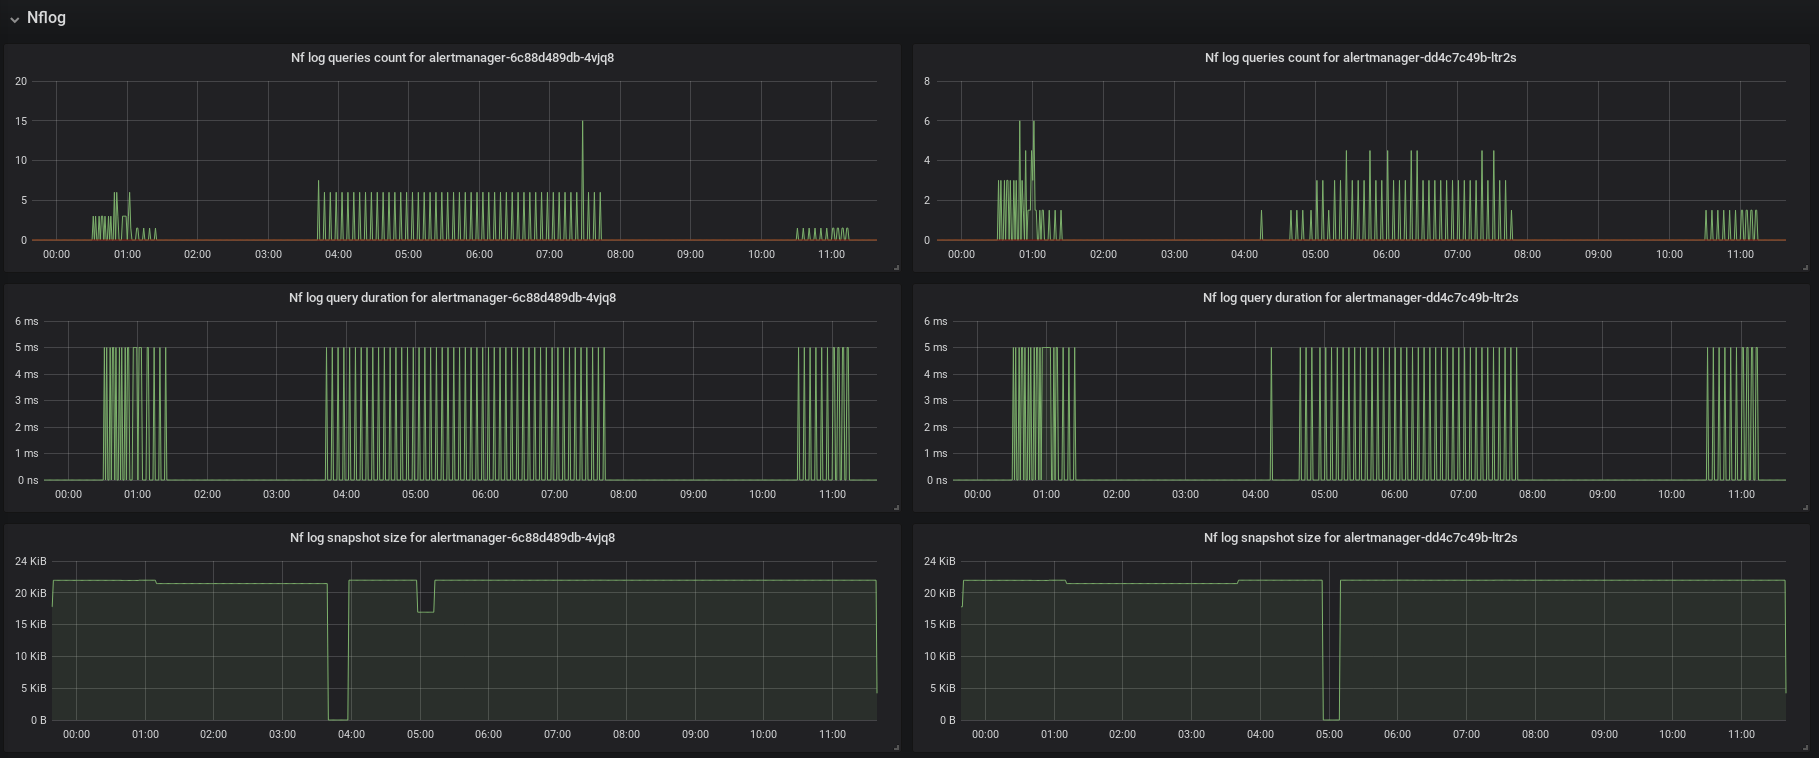
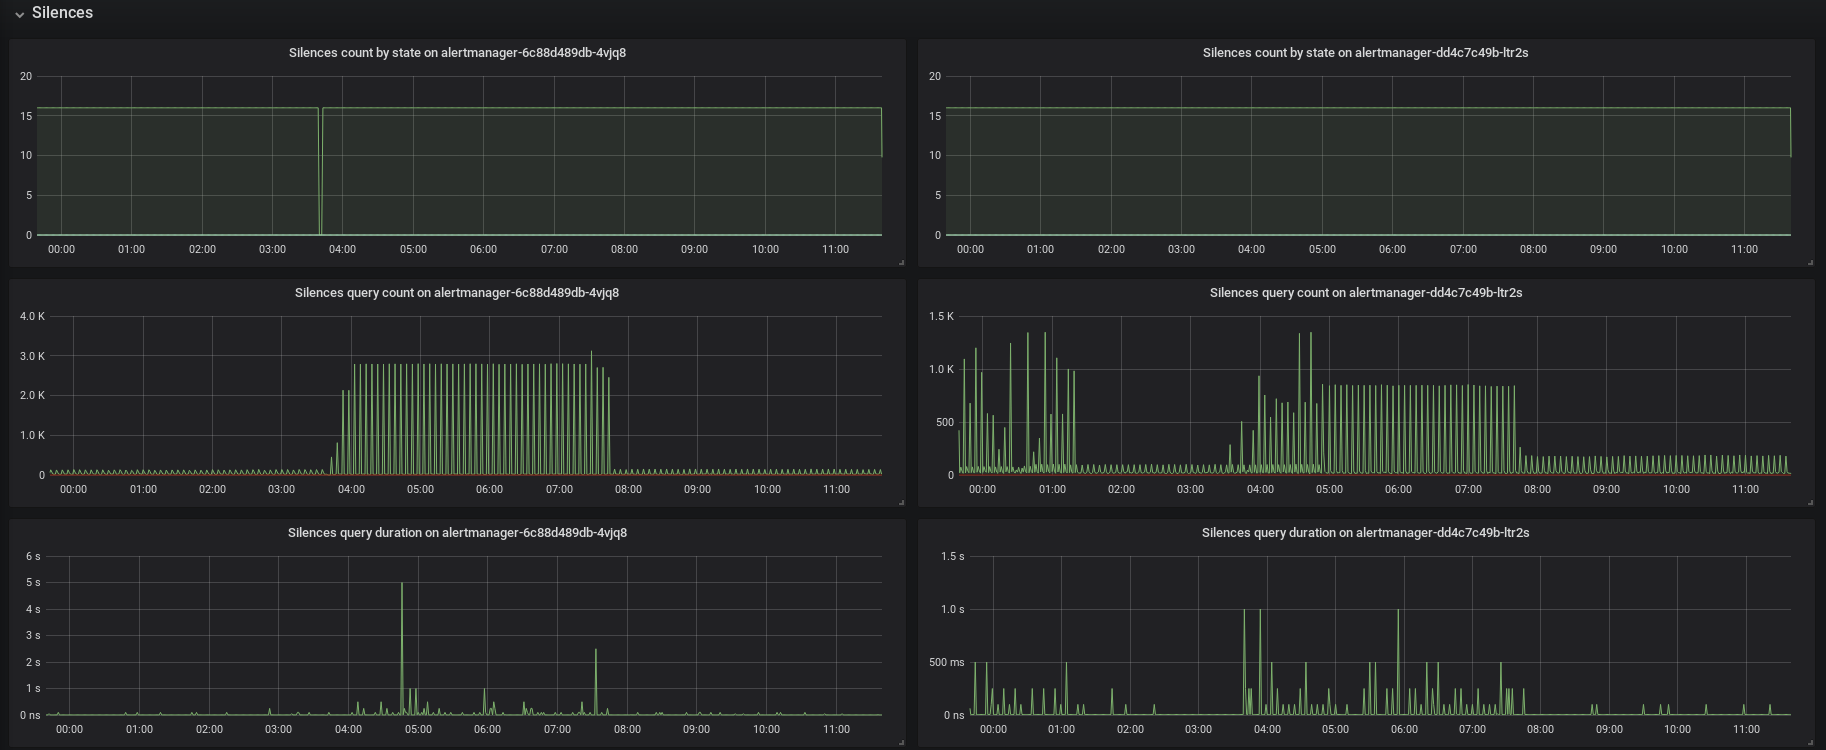
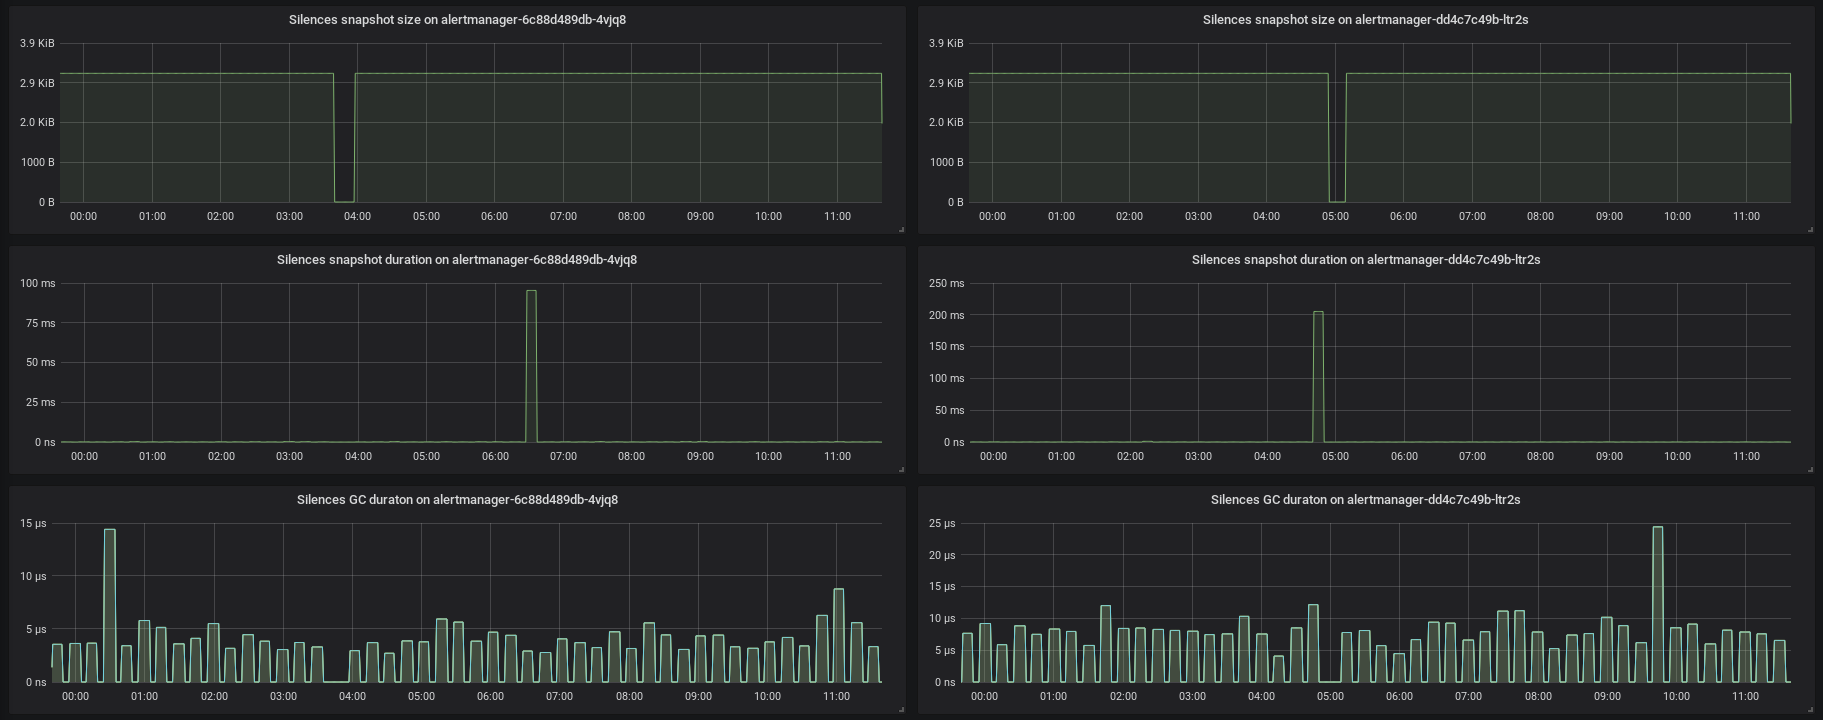
This dashboard monitors Alertmanager health, configuration state, and delivery performance across a cluster. It highlights operational metrics such as alertmanager_build_info, alertmanager_config_last_reload_success_timestamp_seconds, and alertmanager_alerts to assess build/version, config reload status, and active alerts; it also surfaces delivery metrics like alertmanager_notifications_total and alertmanager_notification_latency_seconds_bucket to gauge notification throughput and latency. Key panels include instance-level views (e.g., Number of active alerts, Instance versions and up time) and cluster-wide indicators (e.g., Cluster size, Number of suppressed alerts, Active silences), enabling quick identification of misconfigurations or delays in alert routing.
Screenshots
Used Metrics 1111
alertmanager_alerts
alertmanager_alerts_received_total
alertmanager_build_info
alertmanager_cluster_members
alertmanager_config_last_reload_success_timestamp_seconds
alertmanager_config_last_reload_successful
alertmanager_notification_latency_seconds_bucket
alertmanager_notifications_failed_total
alertmanager_notifications_total
alertmanager_silences
-
process_start_time_seconds