Alertmanager告警总览 1,1551,155
1/17/2019
1/17/2019
1
>=5.0.3
Prometheus
Description
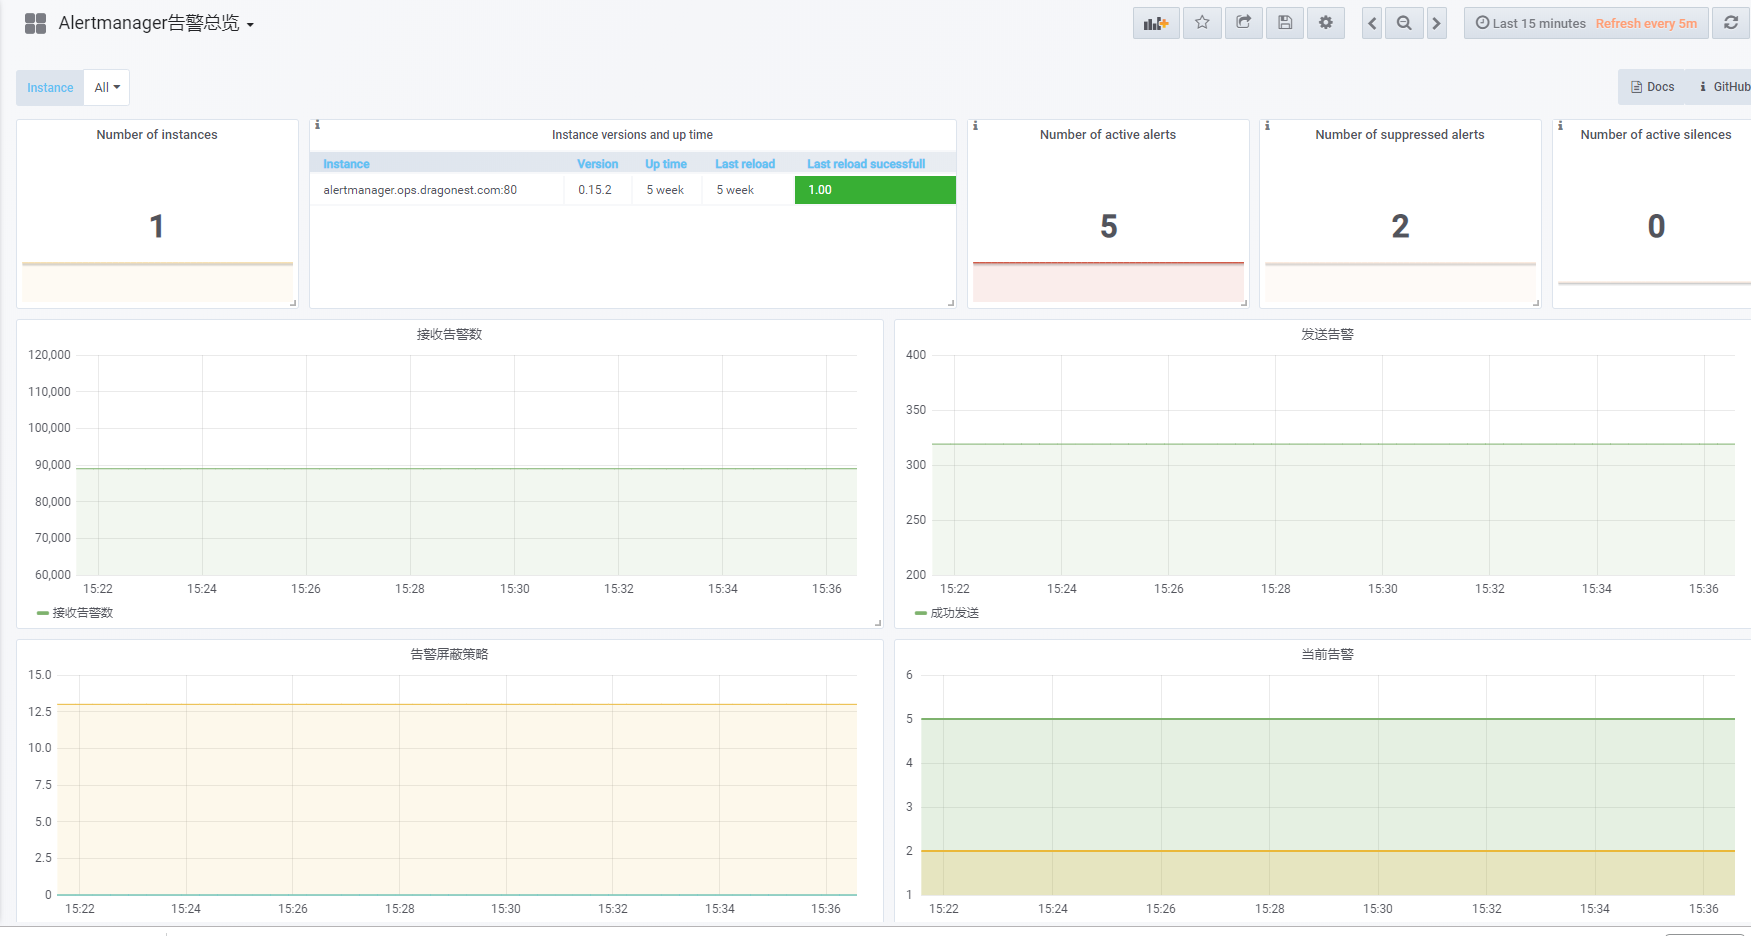
Dashboard showing Prometheus Alertmanager metrics for observing status of the cluster and possible debbuging.
AlertManager告警总览
Screenshots
Used Metrics 88
alertmanager_alerts
alertmanager_alerts_received_total
alertmanager_build_info
alertmanager_config_last_reload_success_timestamp_seconds
alertmanager_config_last_reload_successful
alertmanager_notifications_total
alertmanager_silences
-
process_start_time_seconds
Get Dashboard✕
Download
Copy to Clipboard