Blackbox Exporter (HTTP prober) 44,776,45544,776,455 5.0 (3 reviews)
12/31/2020
12/31/2020
1
Web Servers
>=7.3.5
Prometheus
Description
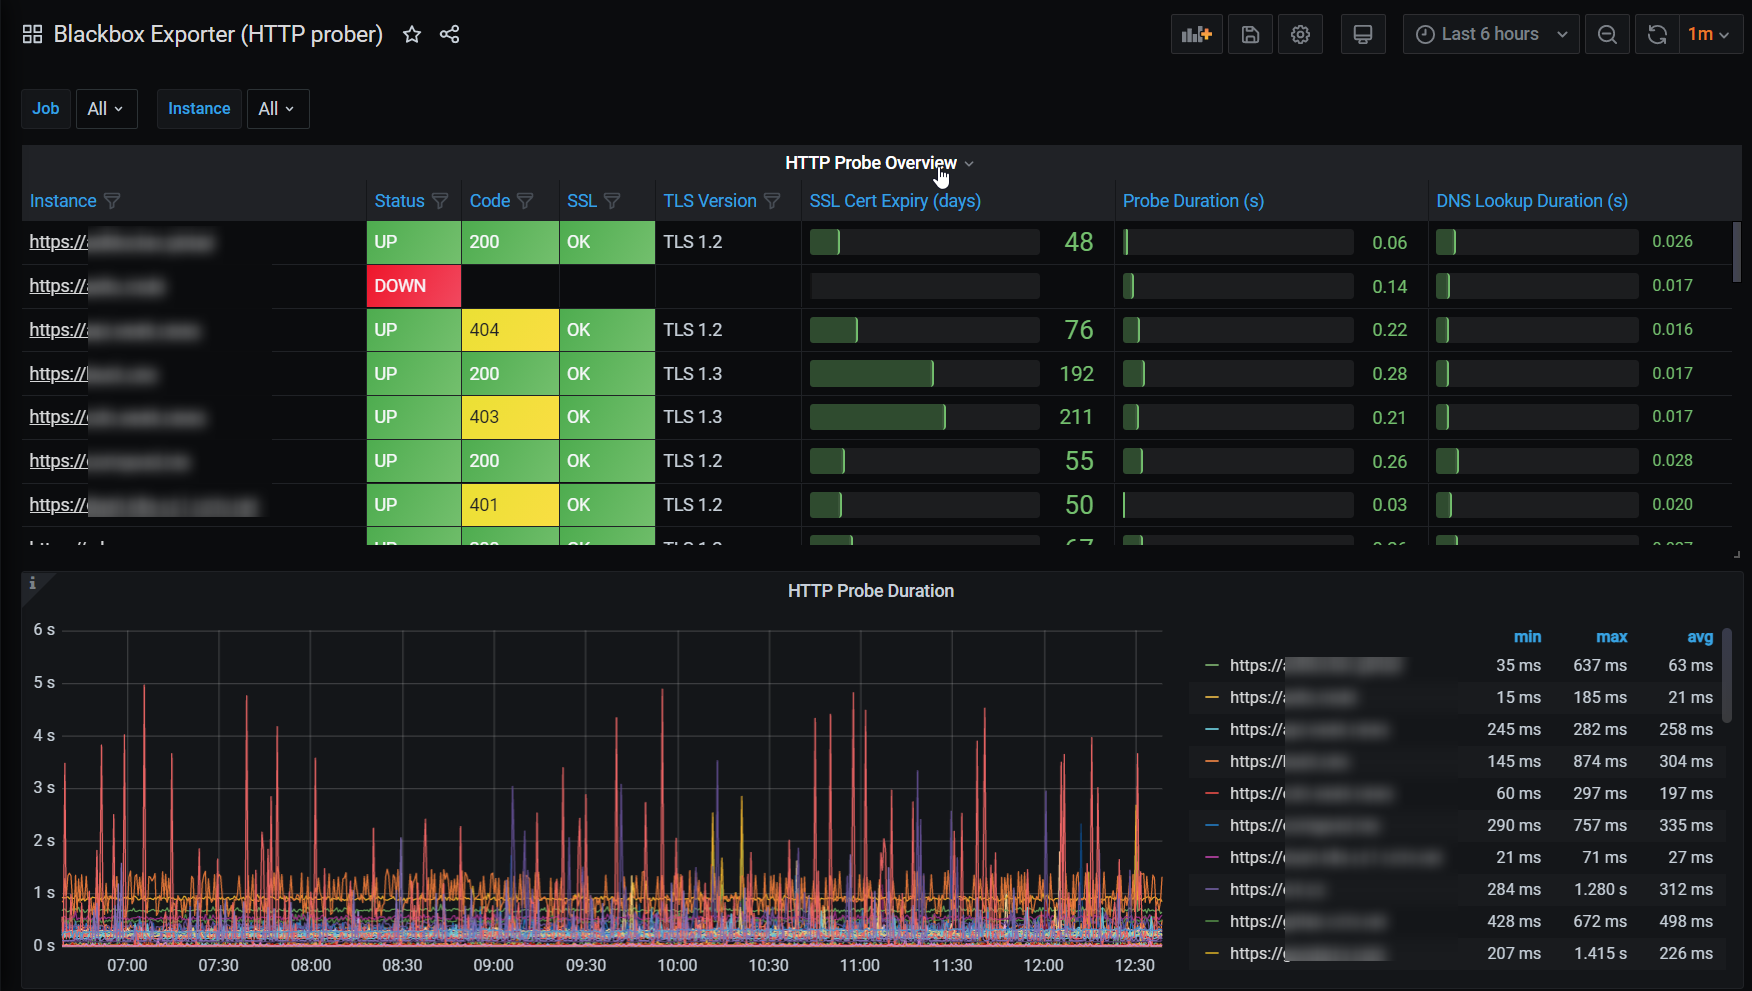
This dashboard monitors HTTP endpoints via Blackbox Exporter to verify availability and end-to-end performance. It highlights probe results and timing with panels such as an overview and duration view, tying together HTTP status behavior, TLS/SSL health, DNS lookup time, and certificate status for quick root-cause analysis. With per-probe detail and concise visuals, you can correlate failures and latency spikes to TLS versions, certificate expiry, and response characteristics.
Screenshots
Get Dashboard✕
Download
Copy to Clipboard