Blackbox Exporter Overview 61,60161,601 4.0 (3 reviews)
3/28/2018
6/26/2023
3
>=5.0.3
Prometheus
Description
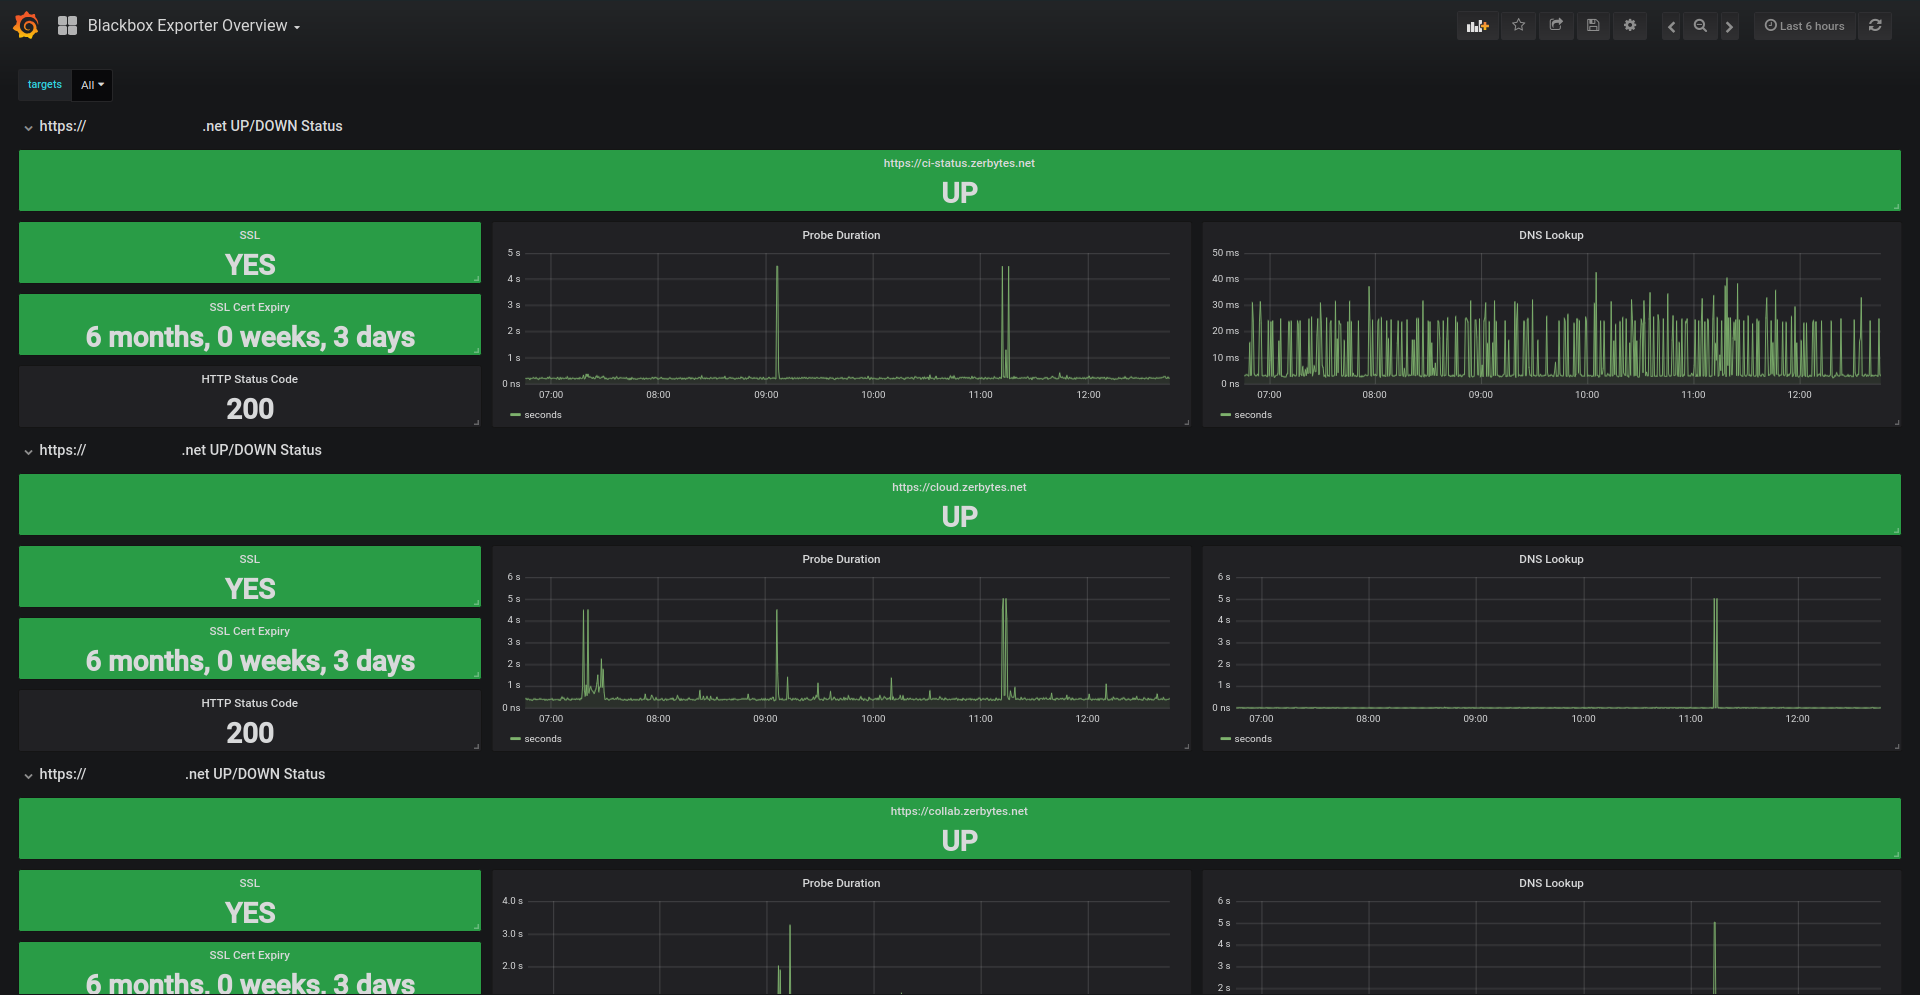
Monitors HTTP(S) and DNS endpoints via Blackbox Exporter, aggregating probe results to reveal reliability and latency characteristics across targets. It emphasizes: probe success and probe duration as core reliability/latency indicators, along with DNS lookup time and SSL certificate expiry to surface DNS and TLS health trends. The dashboards expose key panels such as probe_success, probe_duration_seconds, probe_dns_lookup_time_seconds, and probe_http_status_code (with context on SSL Cert Expiry and HTTP responses) to diagnose availability, performance, and certificate validity at a glance.
Screenshots

Get Dashboard✕
Download
Copy to Clipboard