Ceph - OSD (Single) 2,598,4192,598,419
3/28/2018
1/9/2023
9
>=9.0.5
Description
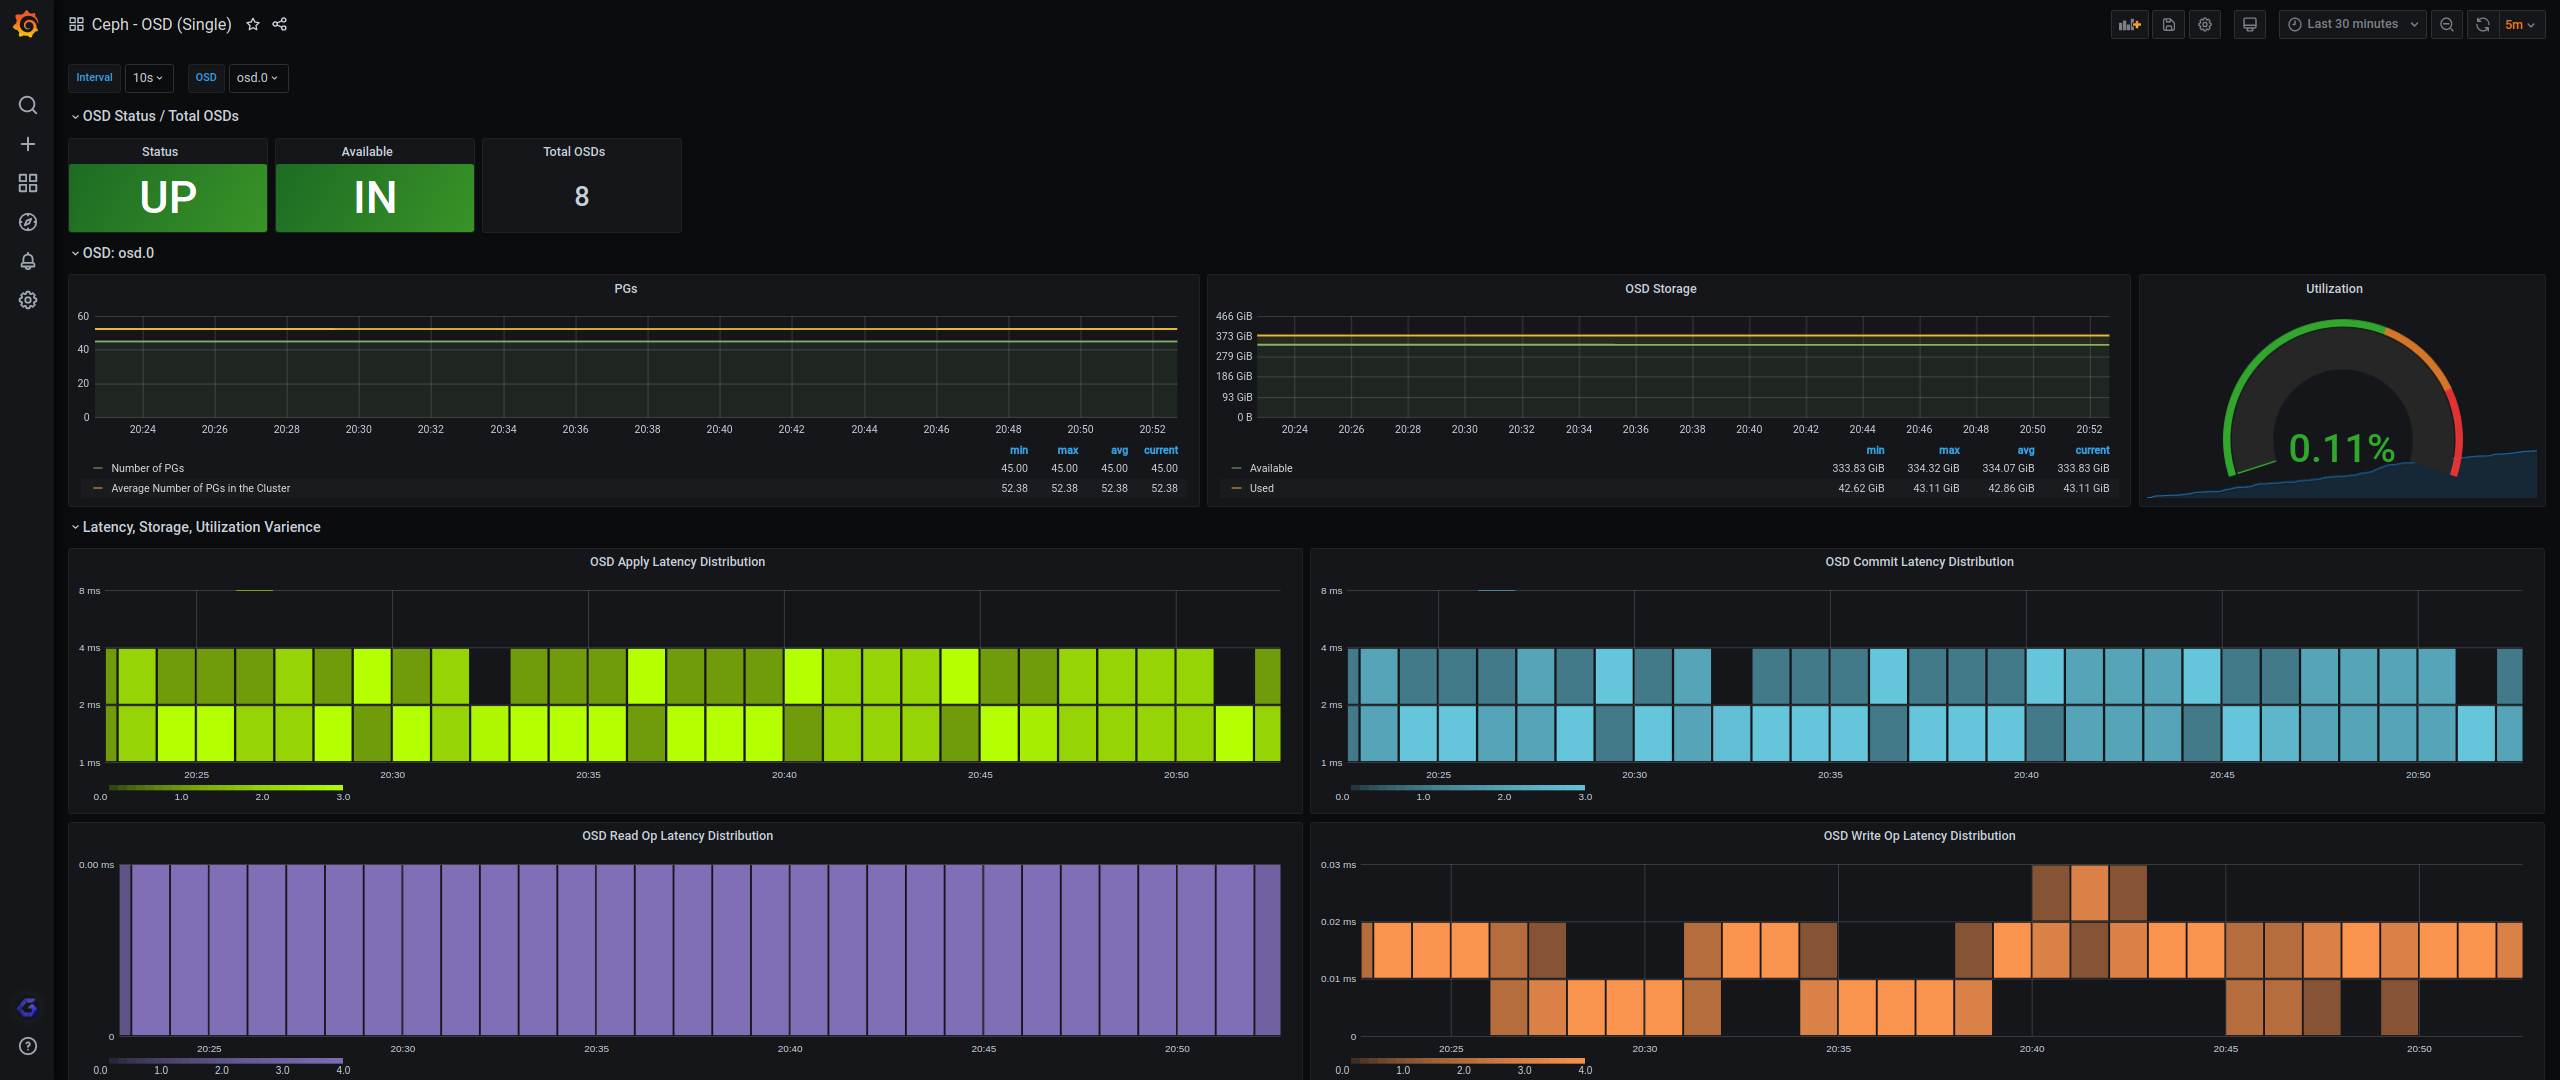
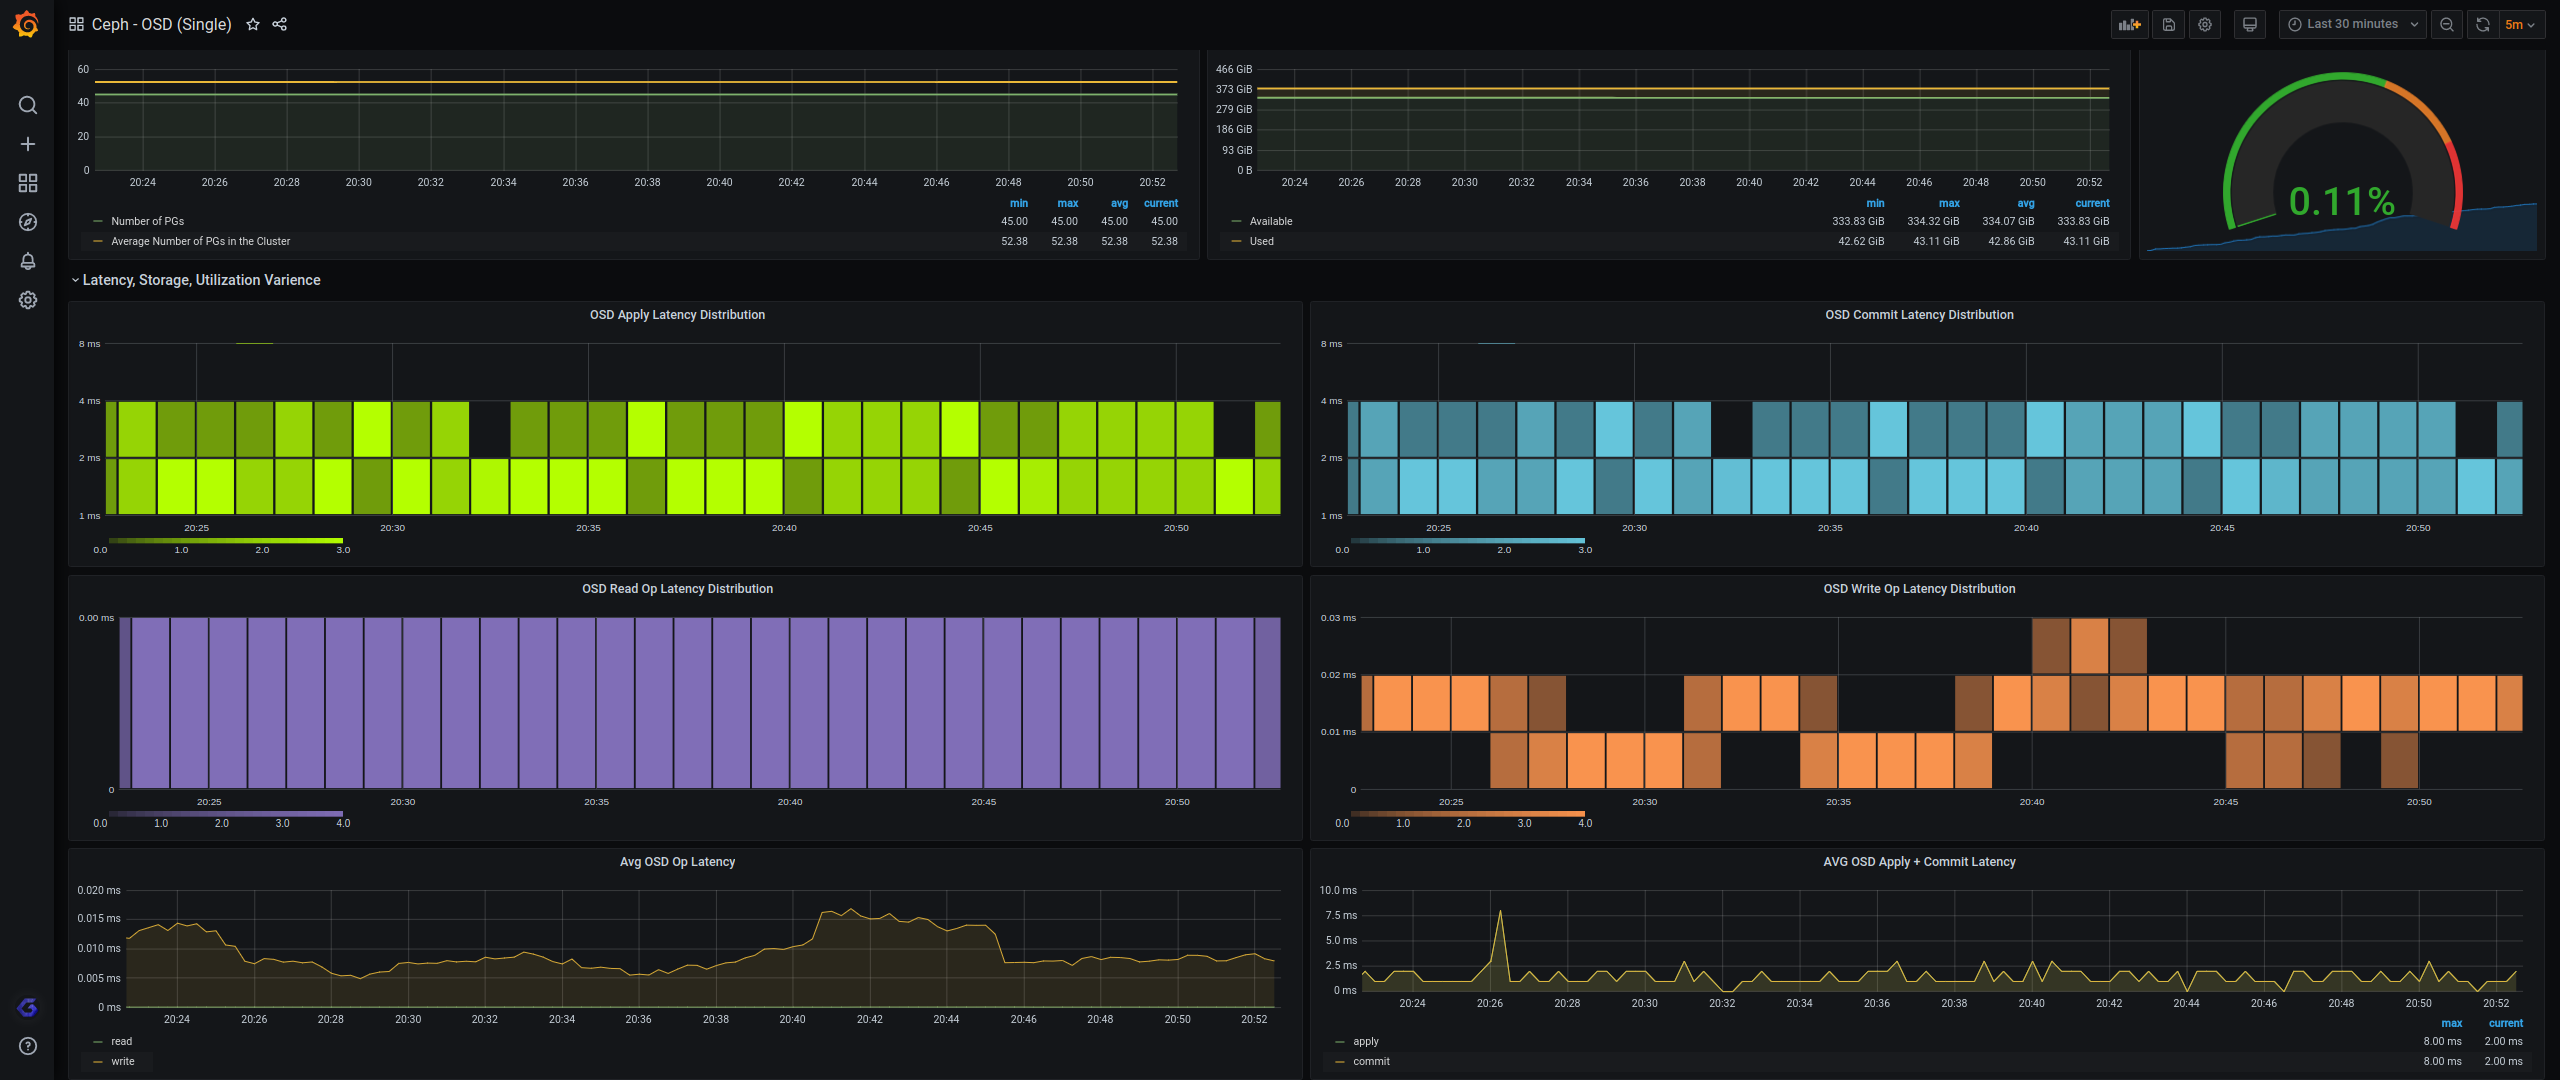
This dashboard monitors the health and performance of Ceph OSDs, aggregating essential cluster state and latency metrics to track availability, usage, and throughput. Key metrics include ceph_osd_up, ceph_osd_stat_bytes/ceph_osd_stat_bytes_used, and latency-related series such as ceph_osd_apply_latency_ms, ceph_osd_commit_latency_ms, and the read/write op latency distributions (ceph_osd_op_r_latency_*, ceph_osd_op_w_latency_*). It provides views for status, capacity (Available/Total OSDs, PG counts), and latency distributions to diagnose bottlenecks and performance issues across OSDs.
Screenshots
Get Dashboard✕
Download
Copy to Clipboard