cert-manager 23,750,45723,750,457
10/16/2019
10/16/2019
1
>=6.3.4
Description
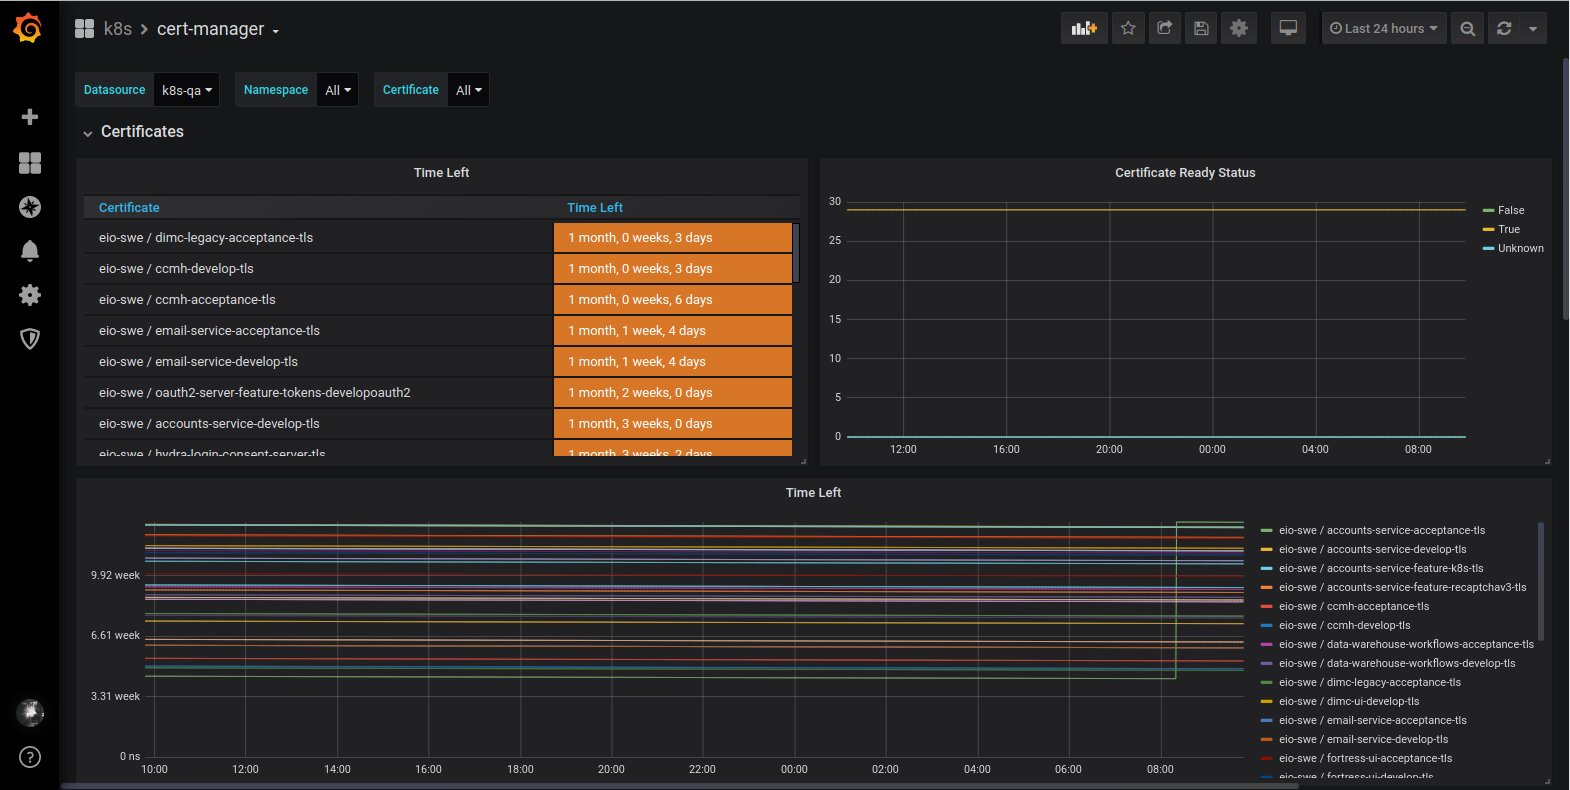
The dashboard monitors certificate lifecycle and ACME client activity for a Kubernetes environment. It highlights critical TLS cert health with certmanager_certificate_expiration_timestamp_seconds and readiness via certmanager_certificate_ready_status, while also tracking HTTP request load on the ACME client with certmanager_http_acme_client_request_count across endpoints like /acme/*, /directory, and /acme/new-account. Overall, it provides time-based views such as Time Left and Overall requests per 2m, enabling quick assessment of certificate expiration risk and ACME plumbing performance.
Screenshots
Used Metrics 33
certmanager_certificate_expiration_timestamp_seconds
certmanager_certificate_ready_status
certmanager_http_acme_client_request_count
Get Dashboard✕
Download
Copy to Clipboard