CoreDNS 40,620,57240,620,572
Description
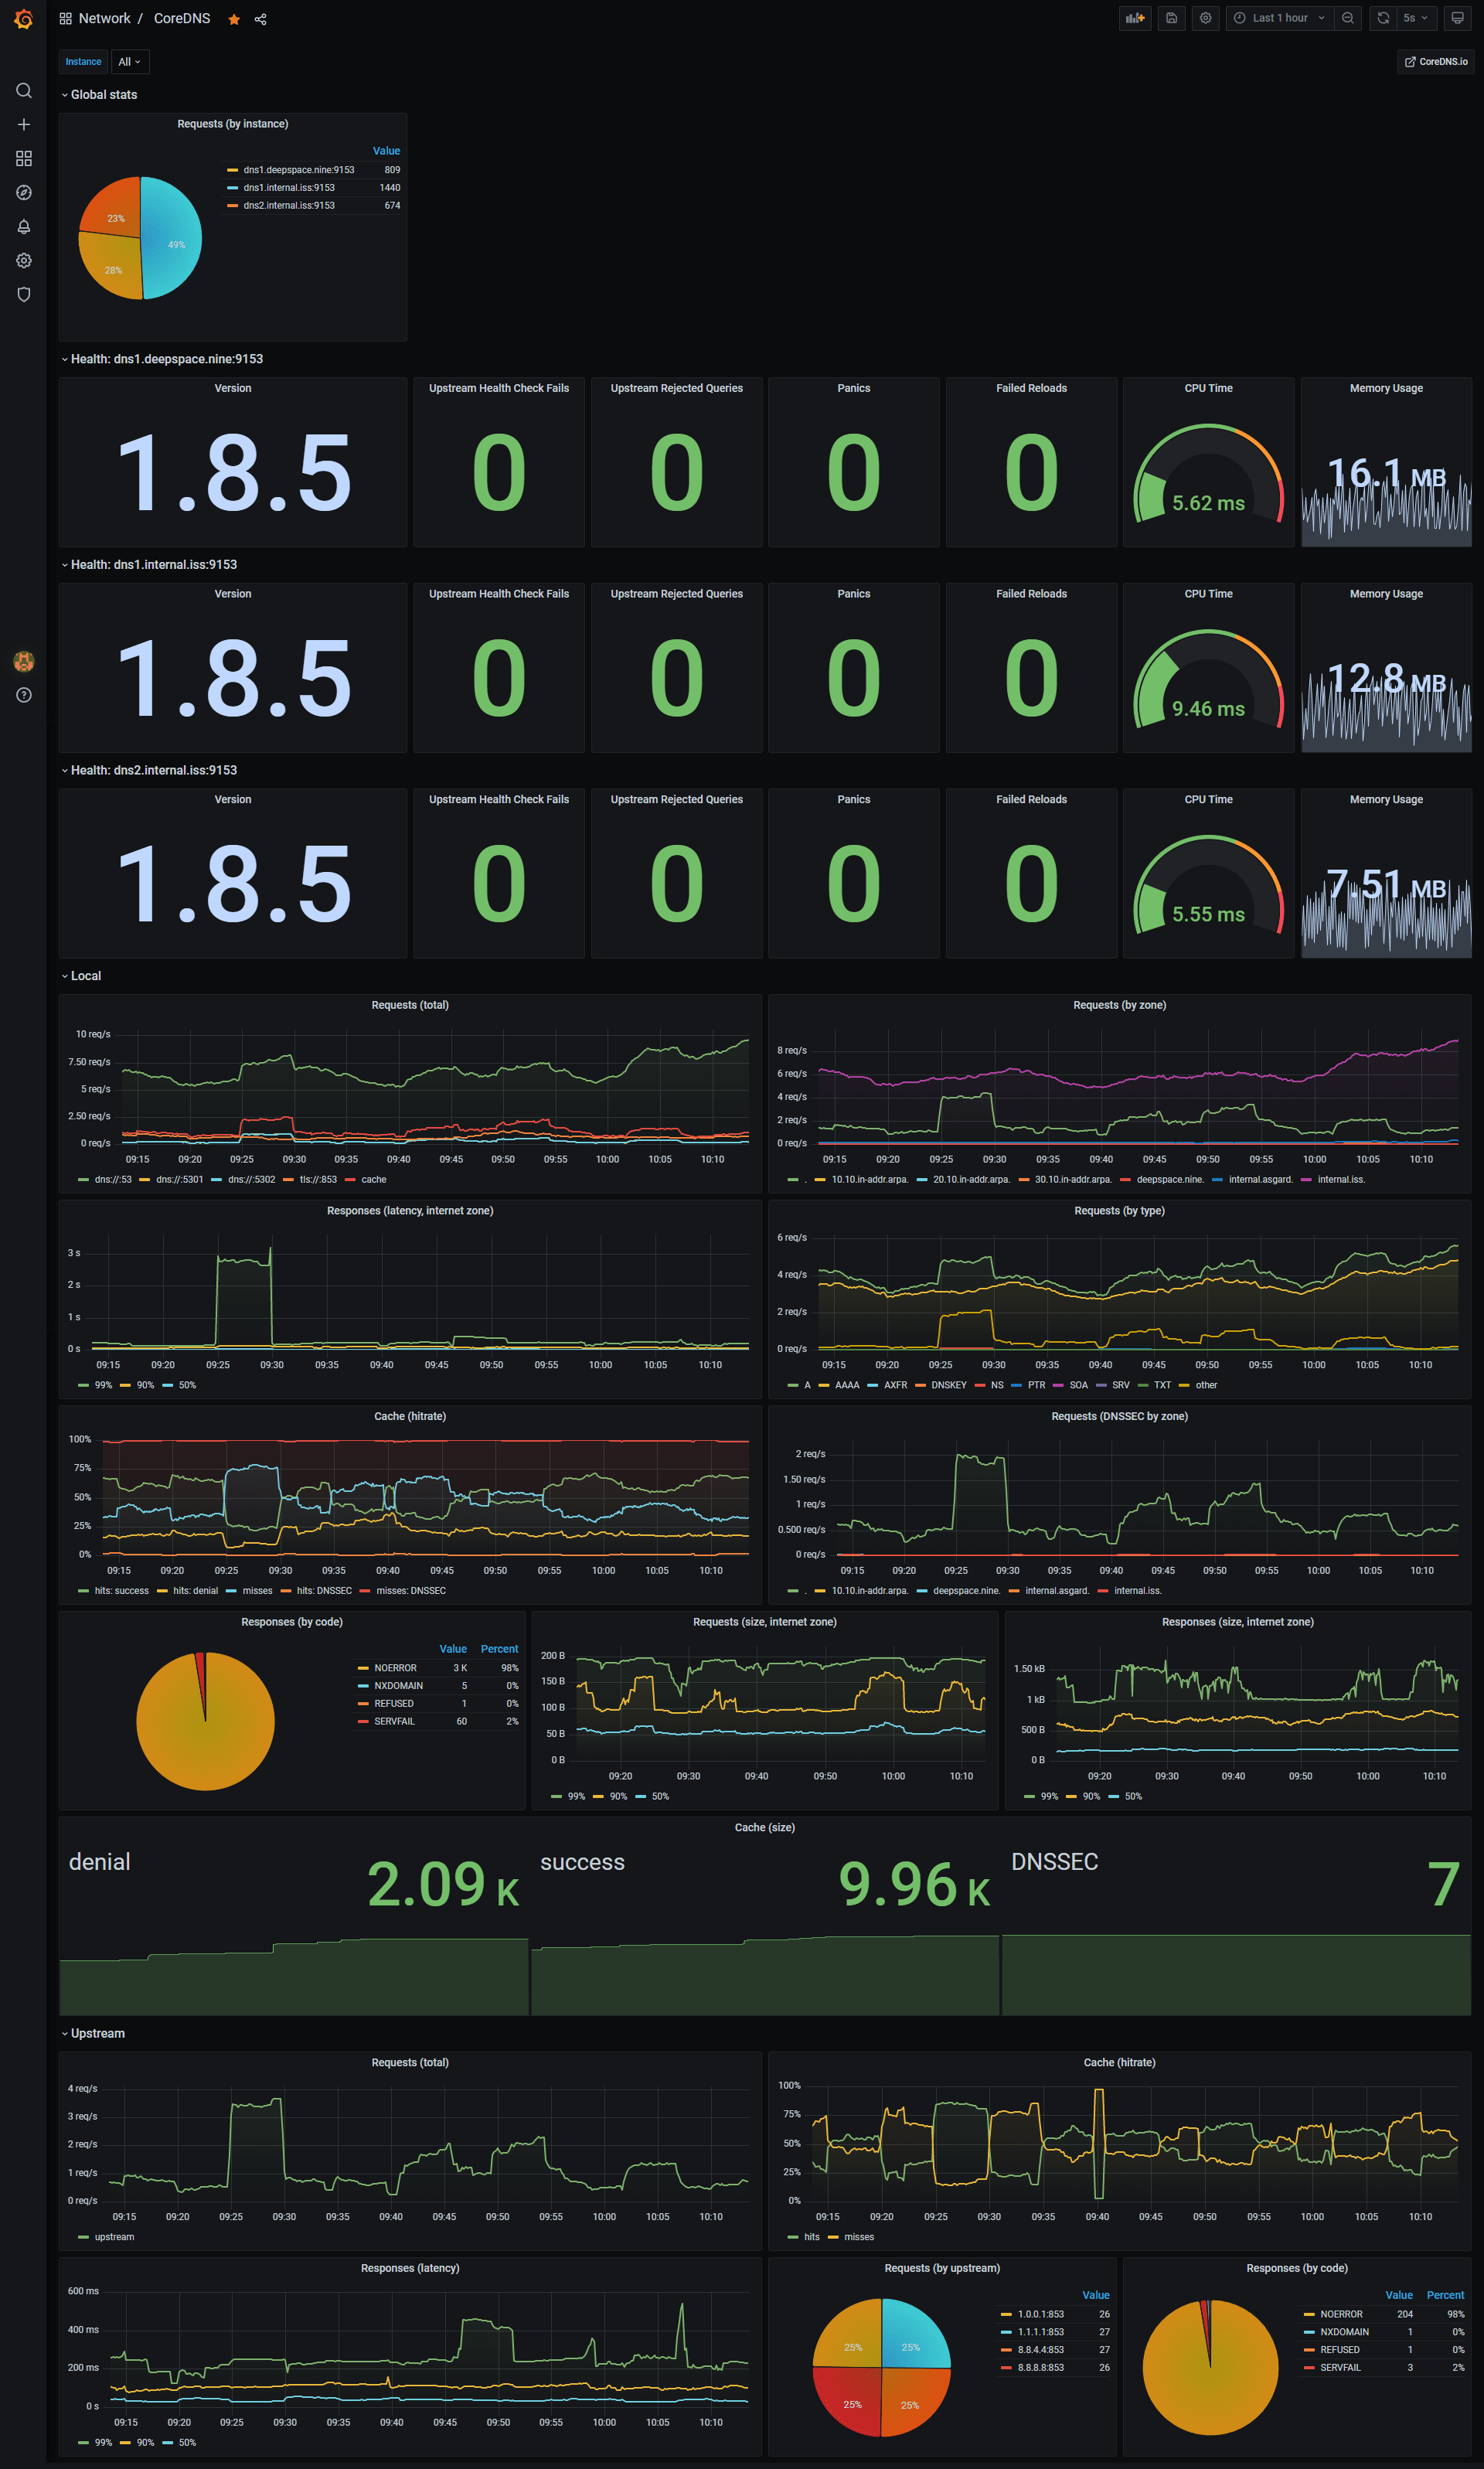
This CoreDNS dashboard provides a comprehensive view of DNS request handling, health, and performance across instances and zones. It combines request rates and latencies with health indicators, cache efficiency, and resource usage (CPU and memory) to help operators diagnose outages, performance regressions, and cache-related improvements, with focused panels for upstream interactions, DNSSEC activity, and error/reload metrics.
Screenshots
Used Metrics 2222
coredns_build_info
coredns_cache_entries
coredns_cache_hits_total
coredns_cache_requests_total
coredns_dns_do_requests_total
coredns_dns_request_duration_seconds_bucket
coredns_dns_request_size_bytes_bucket
coredns_dns_requests_total
coredns_dns_response_size_bytes_bucket
coredns_dns_responses_total
coredns_dnssec_cache_entries
coredns_dnssec_cache_hits_total
coredns_forward_conn_cache_hits_total
coredns_forward_healthcheck_broken_total
coredns_forward_max_concurrent_rejects_total
coredns_forward_request_duration_seconds_bucket
coredns_forward_requests_total
coredns_forward_responses_total
coredns_panics_total
coredns_reload_failed_total
-
go_memstats_alloc_bytes
-
process_cpu_seconds_total