Dashboard - Apache Web Server 1,1621,162
1/18/2023
1/18/2023
1
Host MetricsWeb Servers
>=8.4.5
Prometheus
Description
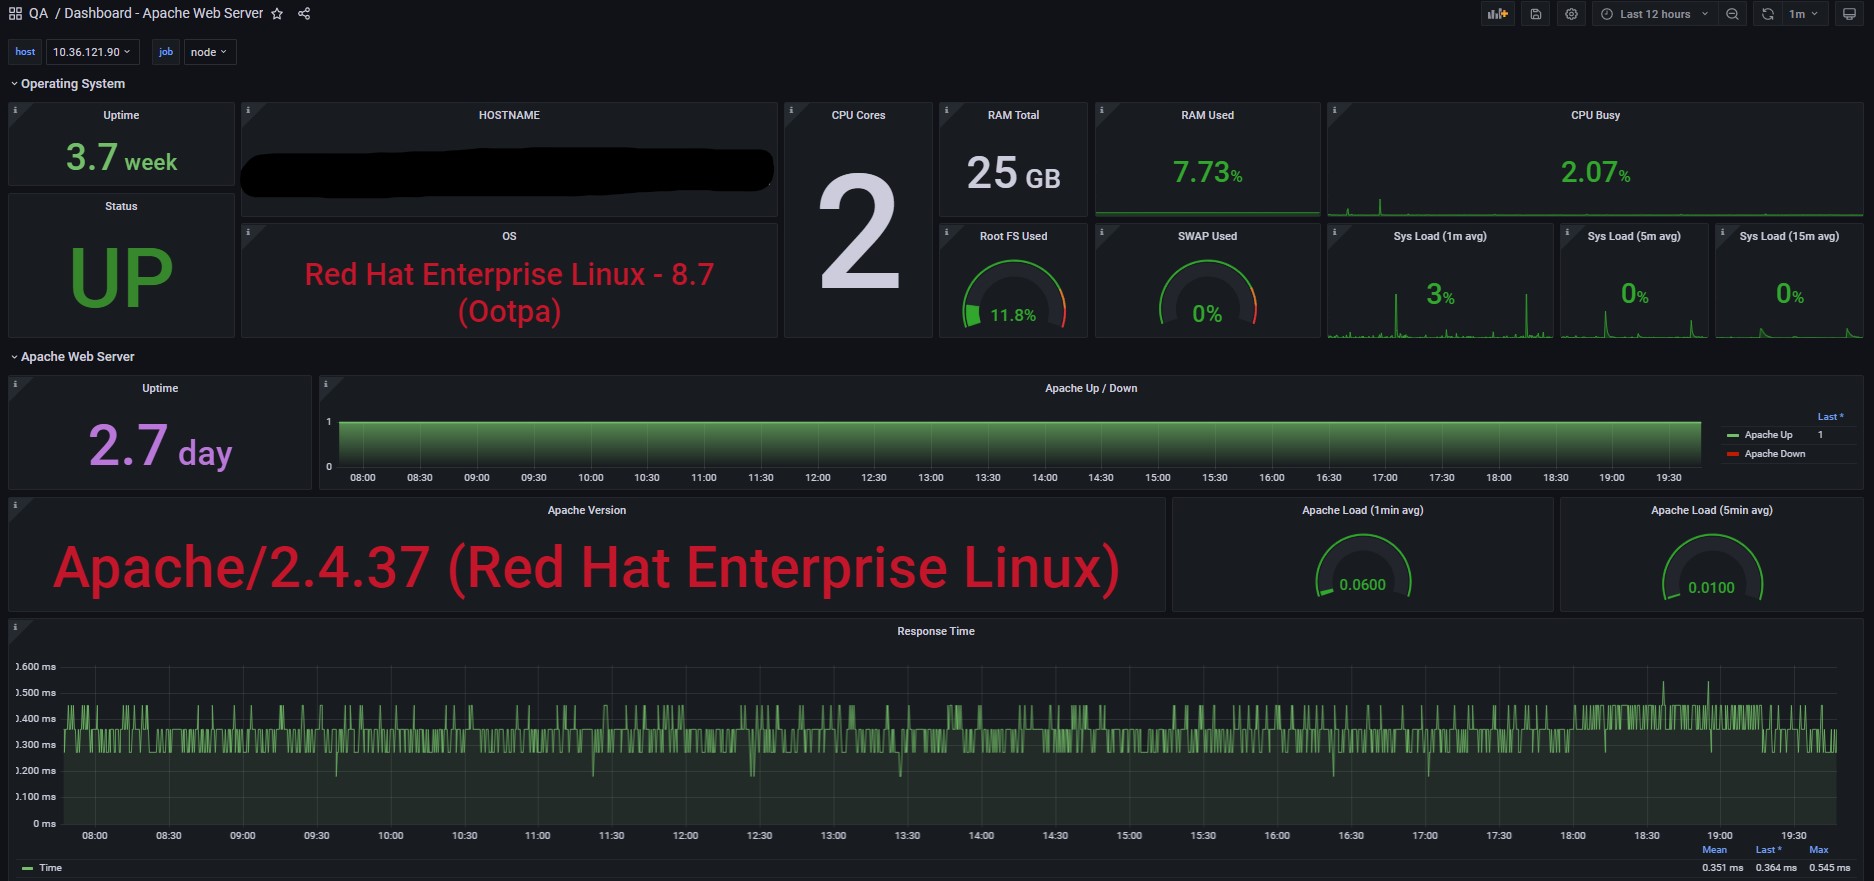
Apache Web Server - Prometheus Dashboard Metrics server-status HTTPD
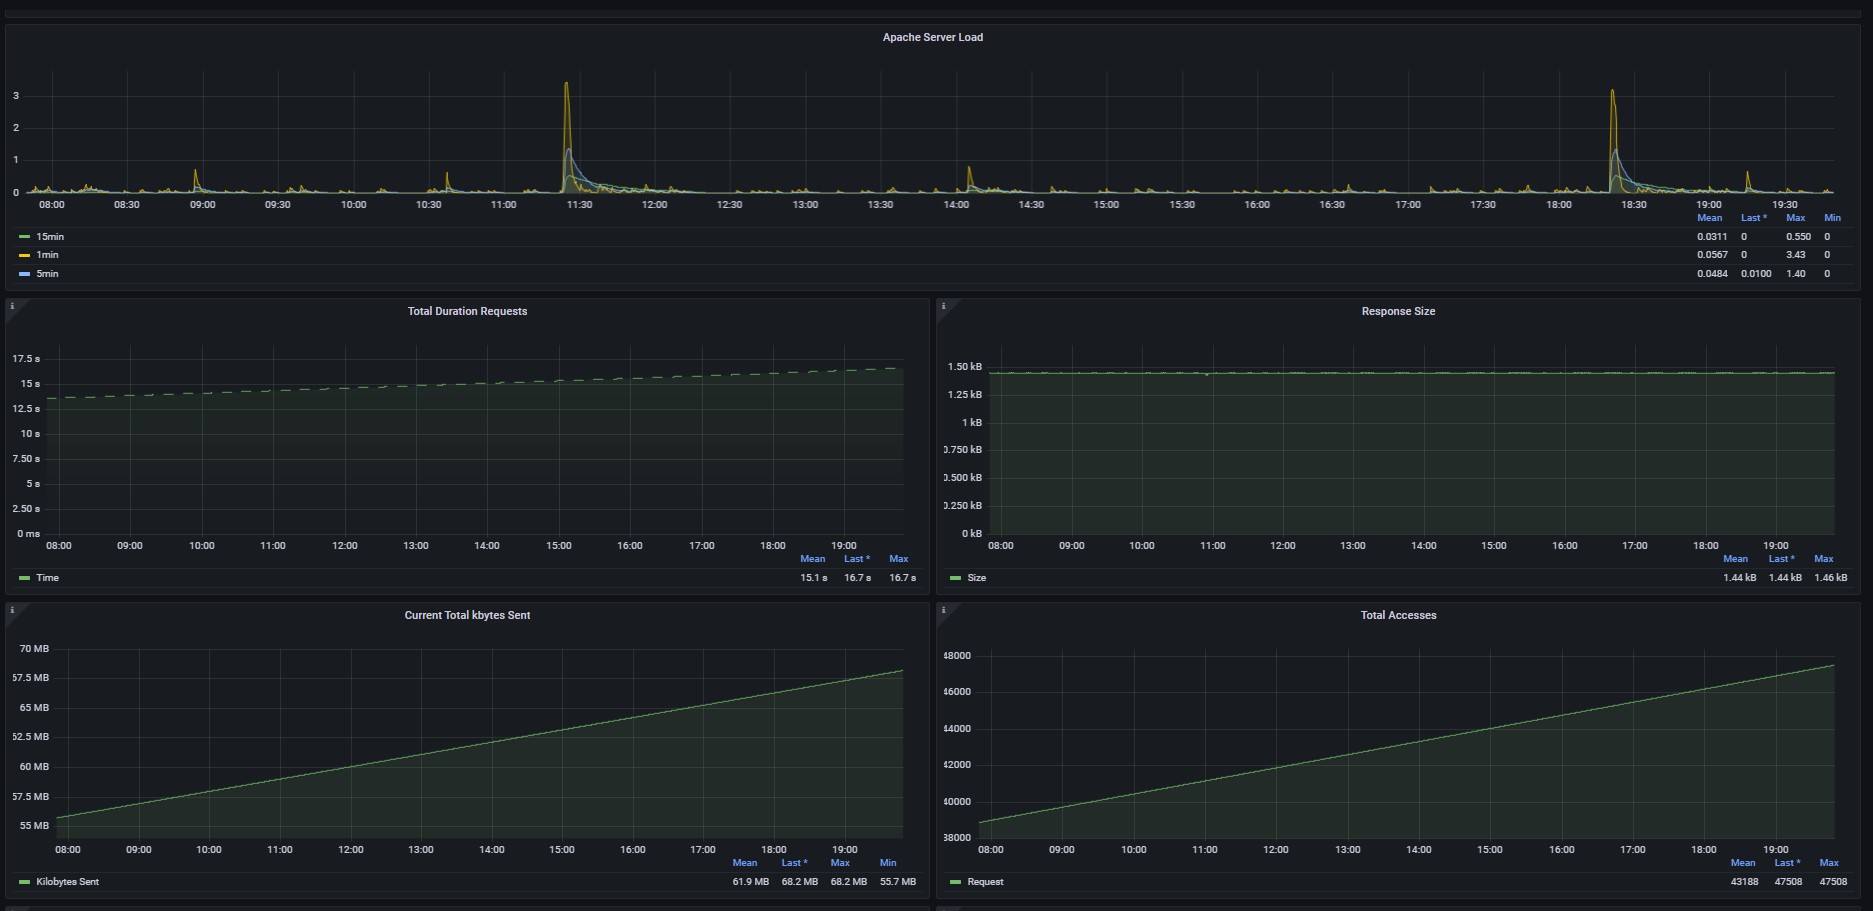
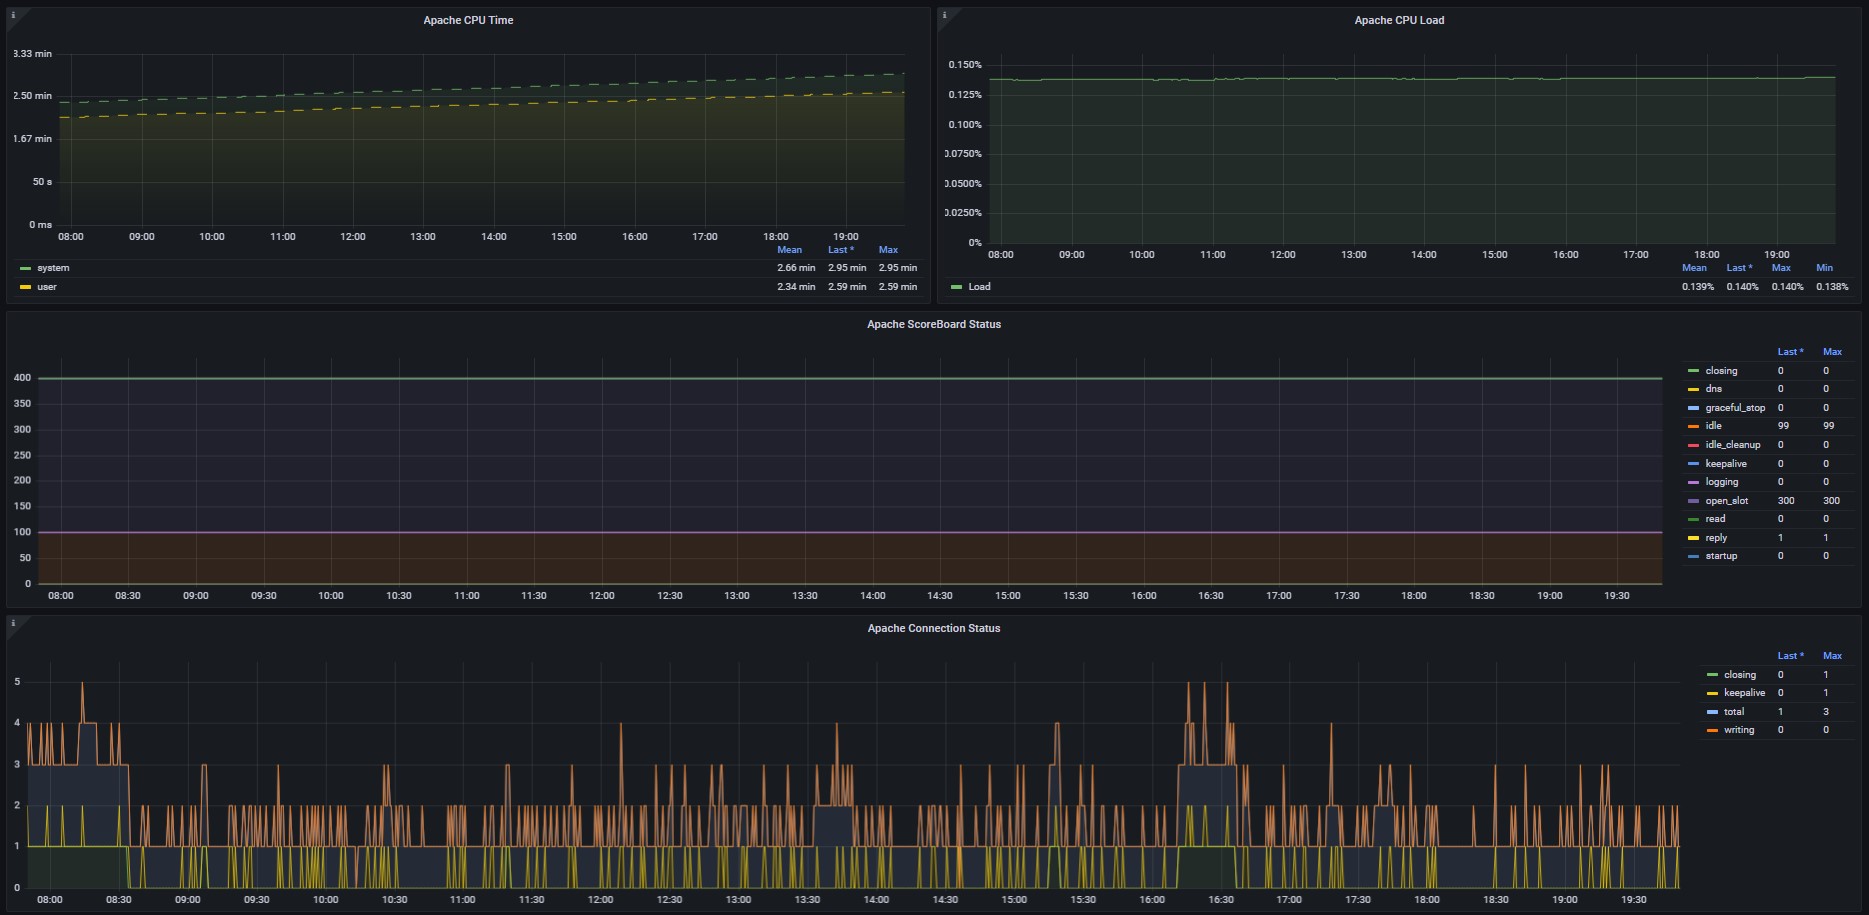
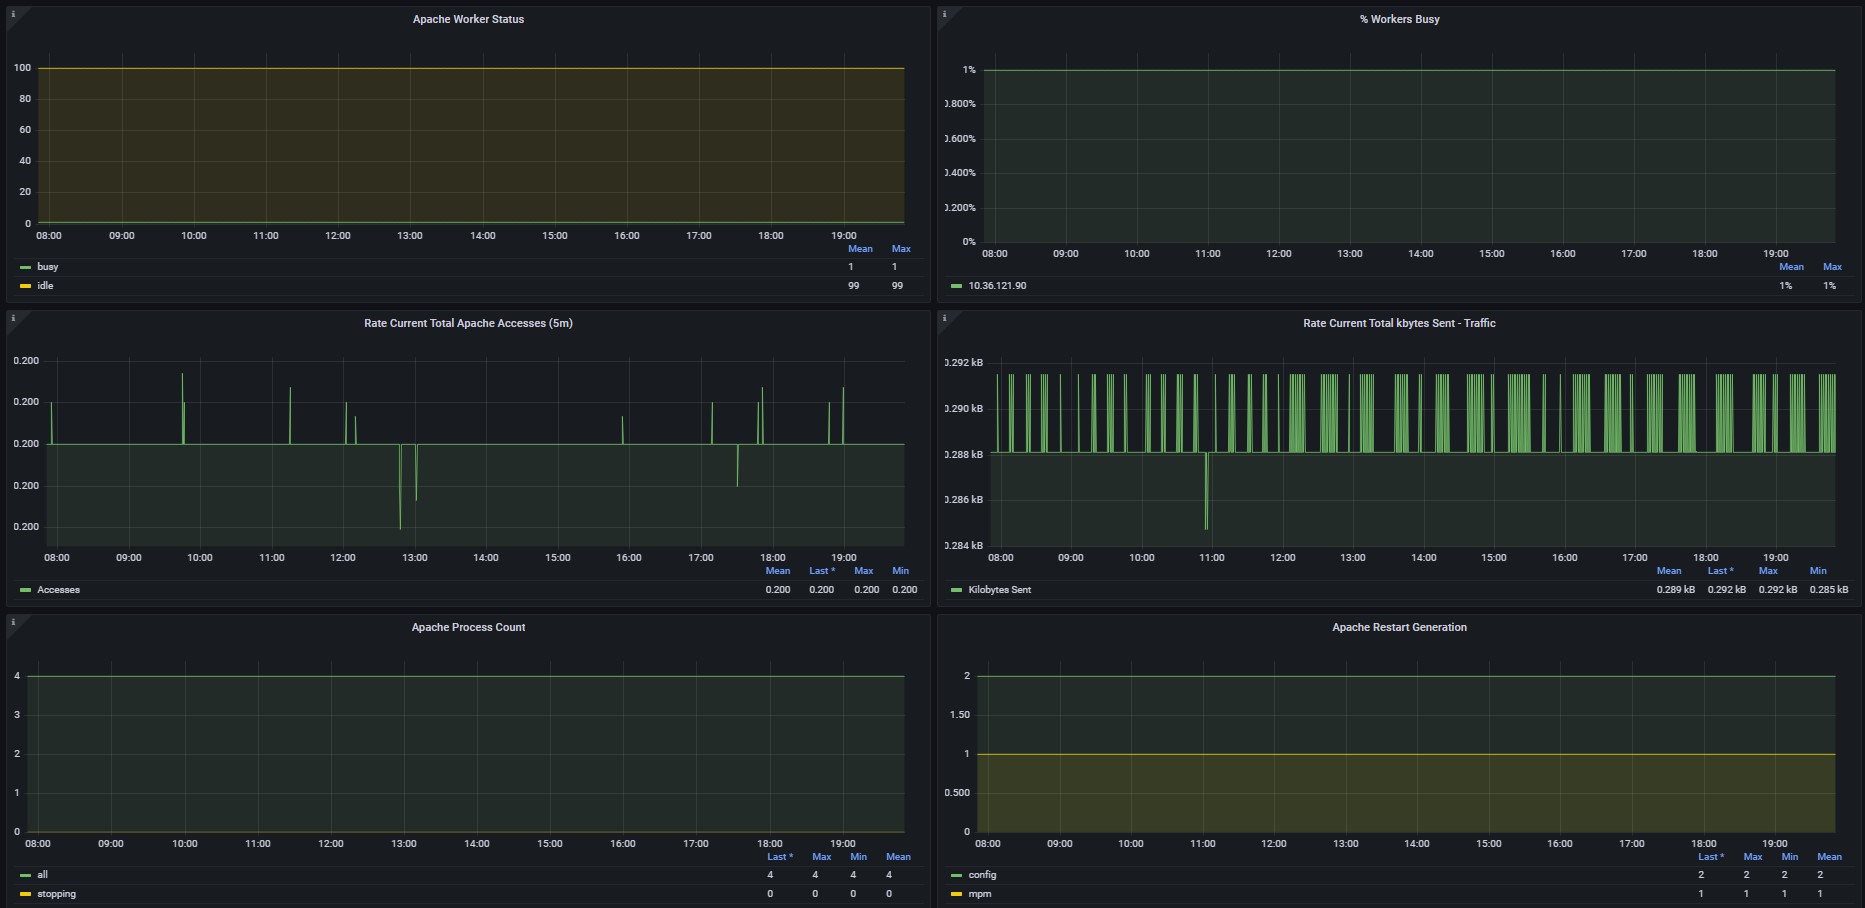
Screenshots
Used Metrics 3030
-
apache_accesses_total
apache_connections
apache_cpu_time_ms_total
apache_cpuload
-
apache_duration_ms_total
apache_generation
apache_info
apache_load
apache_processes
-
apache_scoreboard
-
apache_sent_kilobytes_total
-
apache_up
-
apache_uptime_seconds_total
-
apache_workers
-
node_boot_time_seconds
-
node_cpu_seconds_total
-
node_filesystem_avail_bytes
-
node_filesystem_size_bytes
-
node_load1
-
node_load15
-
node_load5
-
node_memory_MemAvailable_bytes
-
node_memory_MemFree_bytes
-
node_memory_MemTotal_bytes
-
node_memory_SwapFree_bytes
-
node_memory_SwapTotal_bytes
node_os_info
-
node_time_seconds
-
node_uname_info
-
up
Get Dashboard✕
Download
Copy to Clipboard