Dashboard Monitoring All Server Overview 3,6523,652
Description
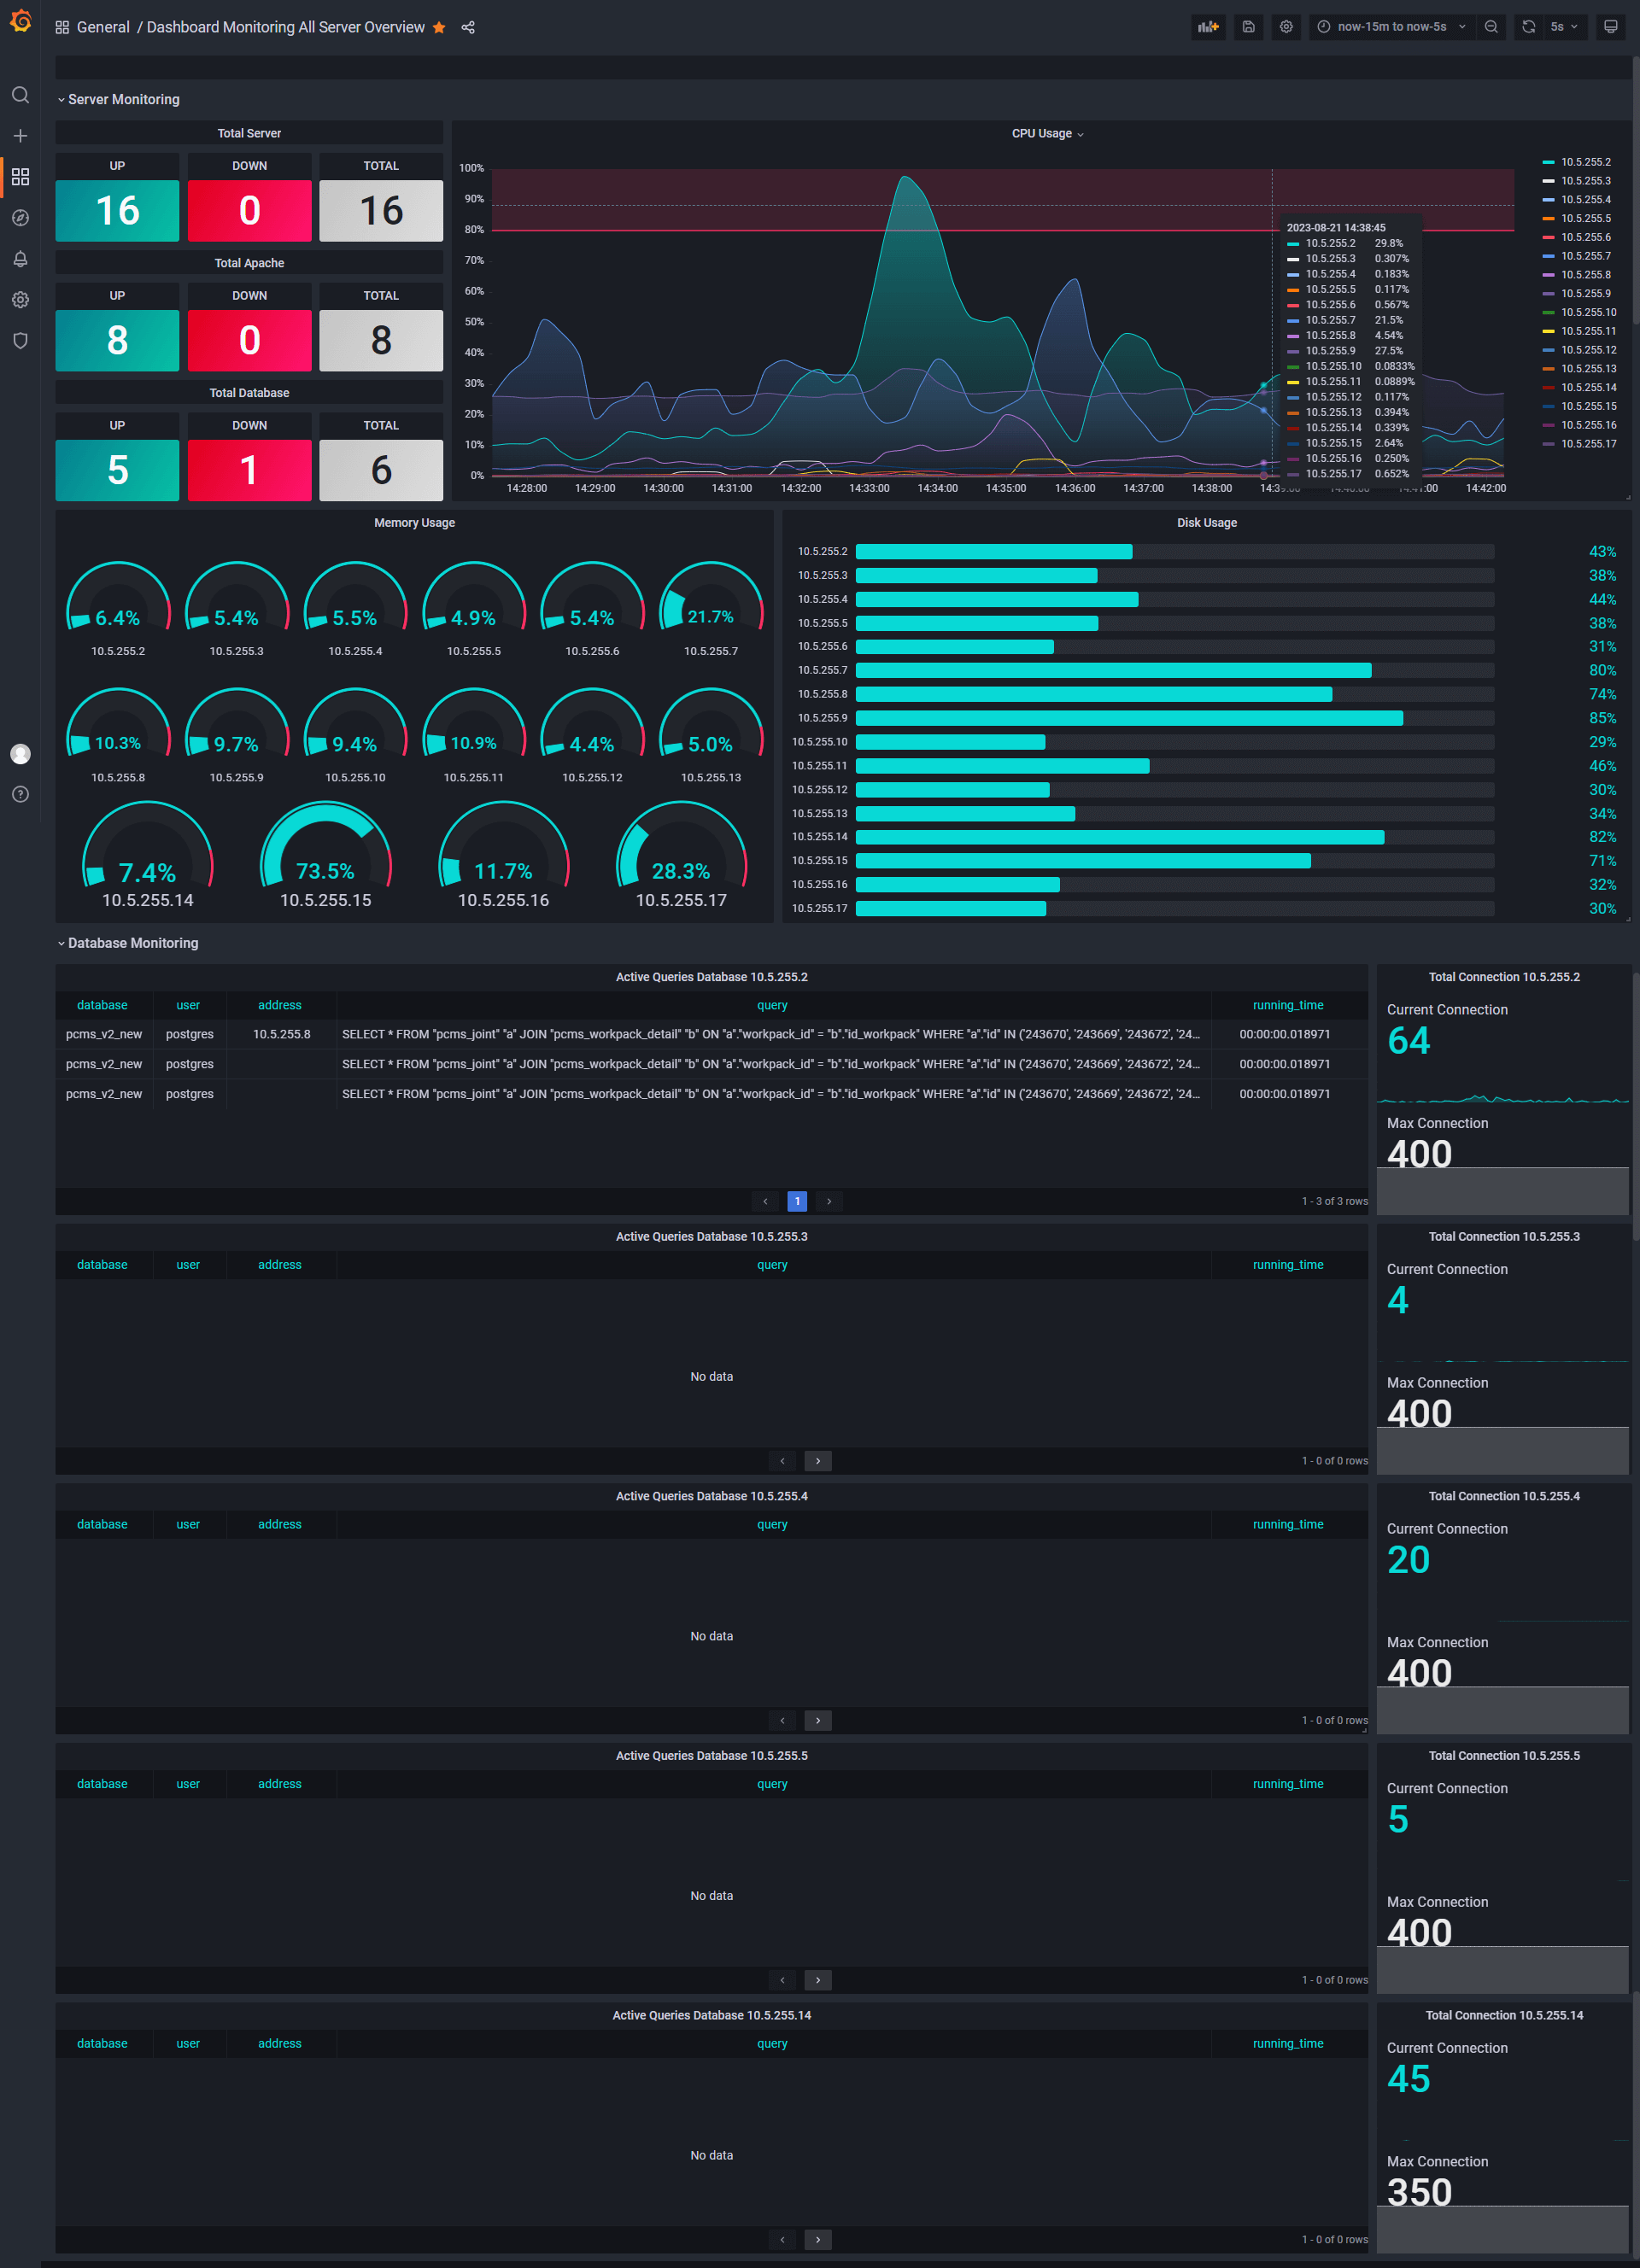
Creating a comprehensive dashboard that amalgamates the vital statistics of multiple servers, encompassing CPU utilization, RAM allocation, disk capacity, and various other metrics. This intricate instrumentation leverages exporters and establishes seamless connectivity with a PostgreSQL backend. This meticulously crafted dashboard finds its purpose in overseeing the health and performance of our web servers.
Screenshots
Used Metrics 1919
-
apache_up
fstype
mountpoint
node_cpu_seconds_total:9100
node_cpu_seconds_total:9110
node_filesystem_avail_bytes:9100
node_filesystem_avail_bytes:9110
node_filesystem_size_bytes:9100
node_filesystem_size_bytes:9110
node_memory_MemAvailable_bytes:9100
node_memory_MemAvailable_bytes:9110
node_memory_MemTotal_bytes:9100
node_memory_MemTotal_bytes:9110
-
node_timex_sync_status
pg_settings_max_connections:9101
pg_stat_activity_count:9101
-
pg_up
rootfs
total_server