Docker and Host Monitoring w/ Prometheus 40,78240,782 4.0 (2 reviews)
Description
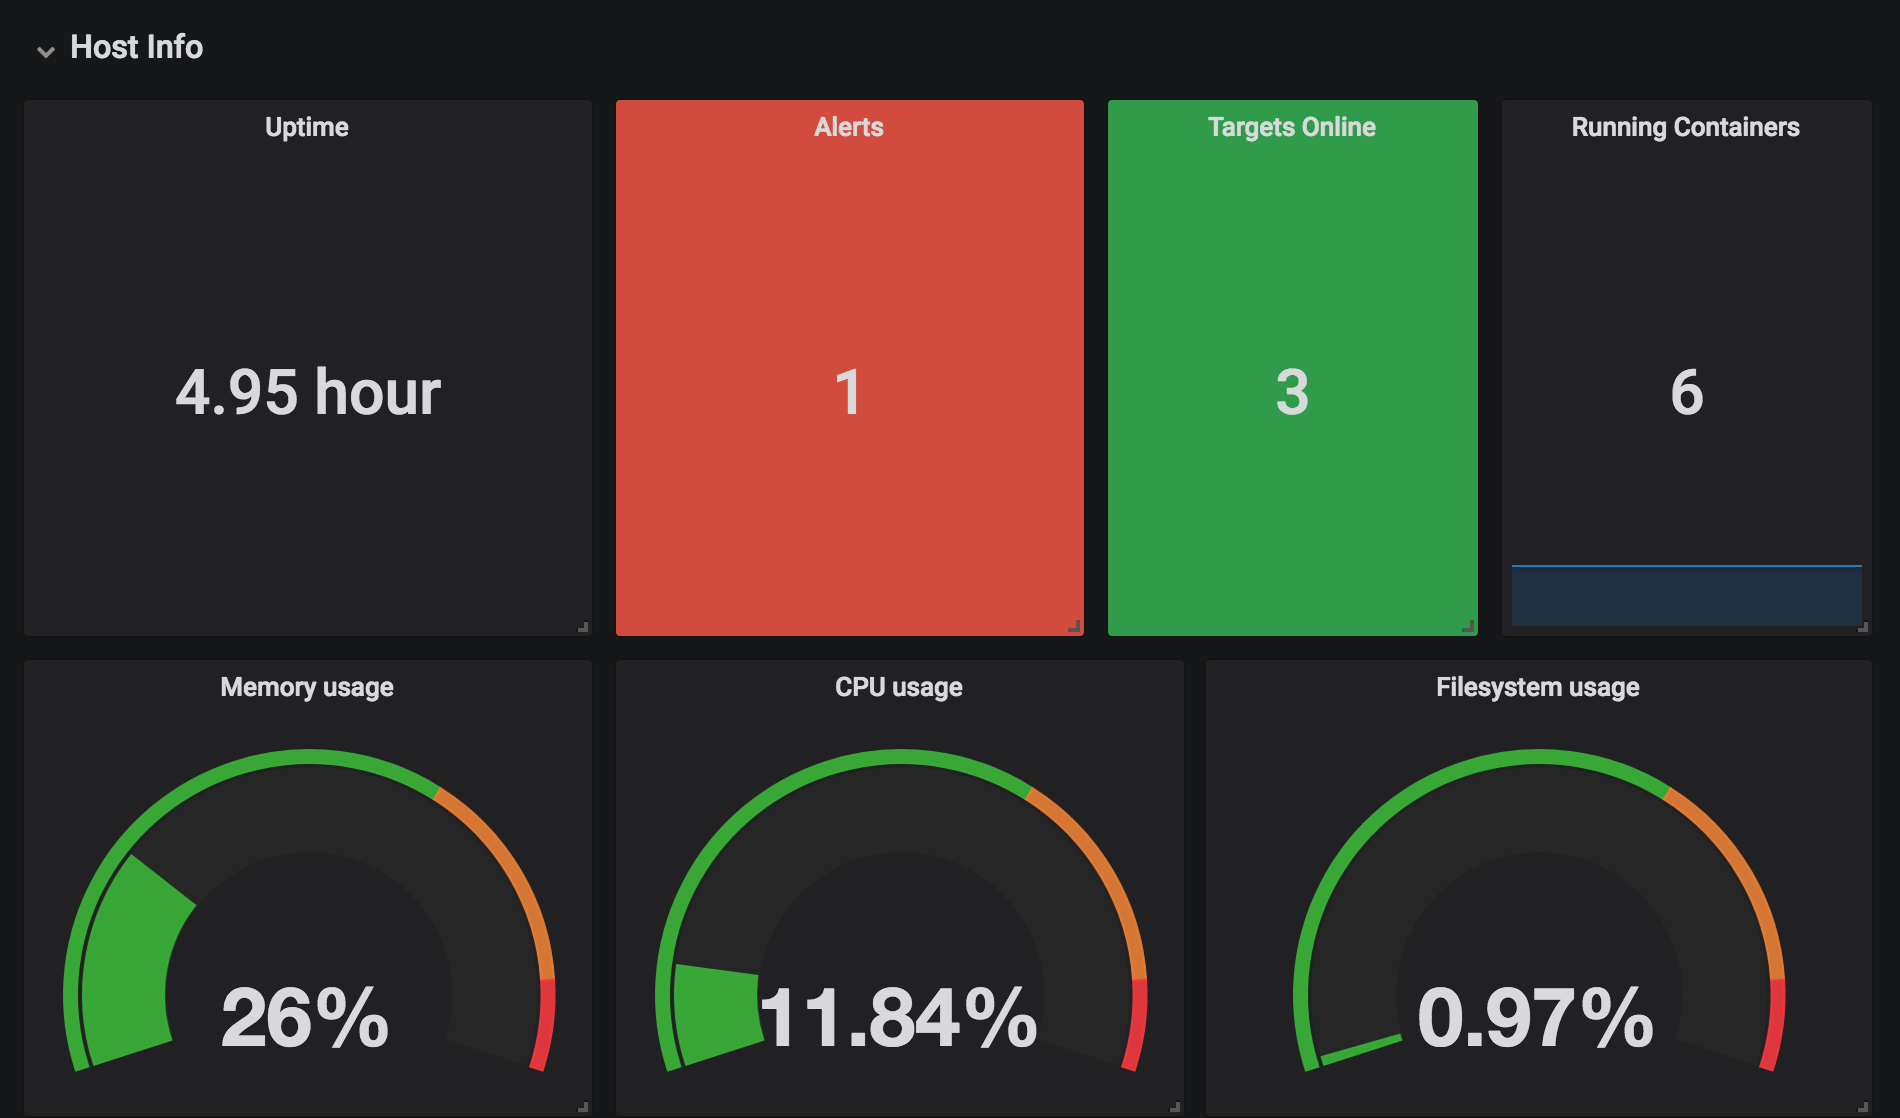
This dashboard monitors both host and container environments by aggregating Prometheus metrics to track availability, resource usage, and container activity. Key features include Uptime/Alerts for quick health checks, and detailed resource metrics such as node_memory_MemTotal_bytes, node_memory_MemFree_bytes, and container_cpu_usage_seconds_total to analyze memory and CPU utilization across hosts and containers.
Screenshots
Used Metrics 2222
ALERTS
-
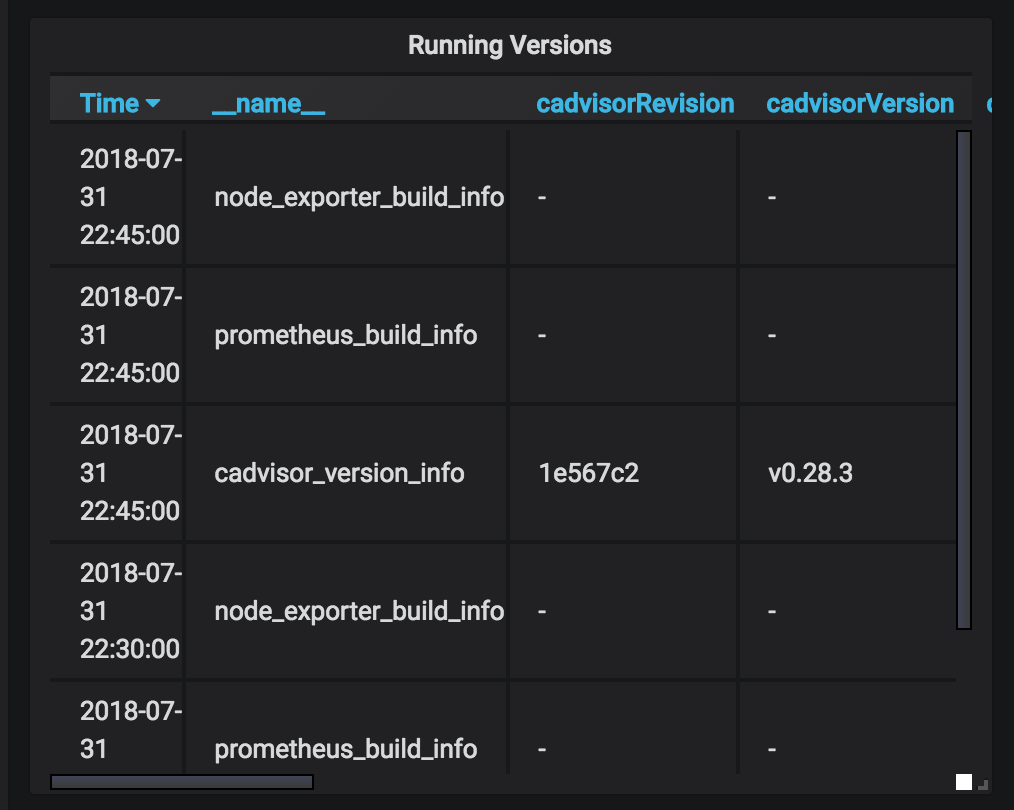
cadvisor_version_info
container_cpu_load_average_
-
container_cpu_usage_seconds_total
-
container_fs_limit_bytes
-
container_fs_usage_bytes
-
container_last_seen
-
container_memory_max_usage_bytes
-
container_network_receive_bytes_total
-
container_network_transmit_bytes_total
interval
-
node_cpu_seconds_total
-
node_exporter_build_info
-
node_filesystem_free_bytes
-
node_memory_Buffers_bytes
-
node_memory_Cached_bytes
-
node_memory_MemAvailable_bytes
-
node_memory_MemFree_bytes
-
node_memory_MemTotal_bytes
-
process_start_time_seconds
-
prometheus_build_info
-
up