Docker Registry 20,812,93220,812,932
Description
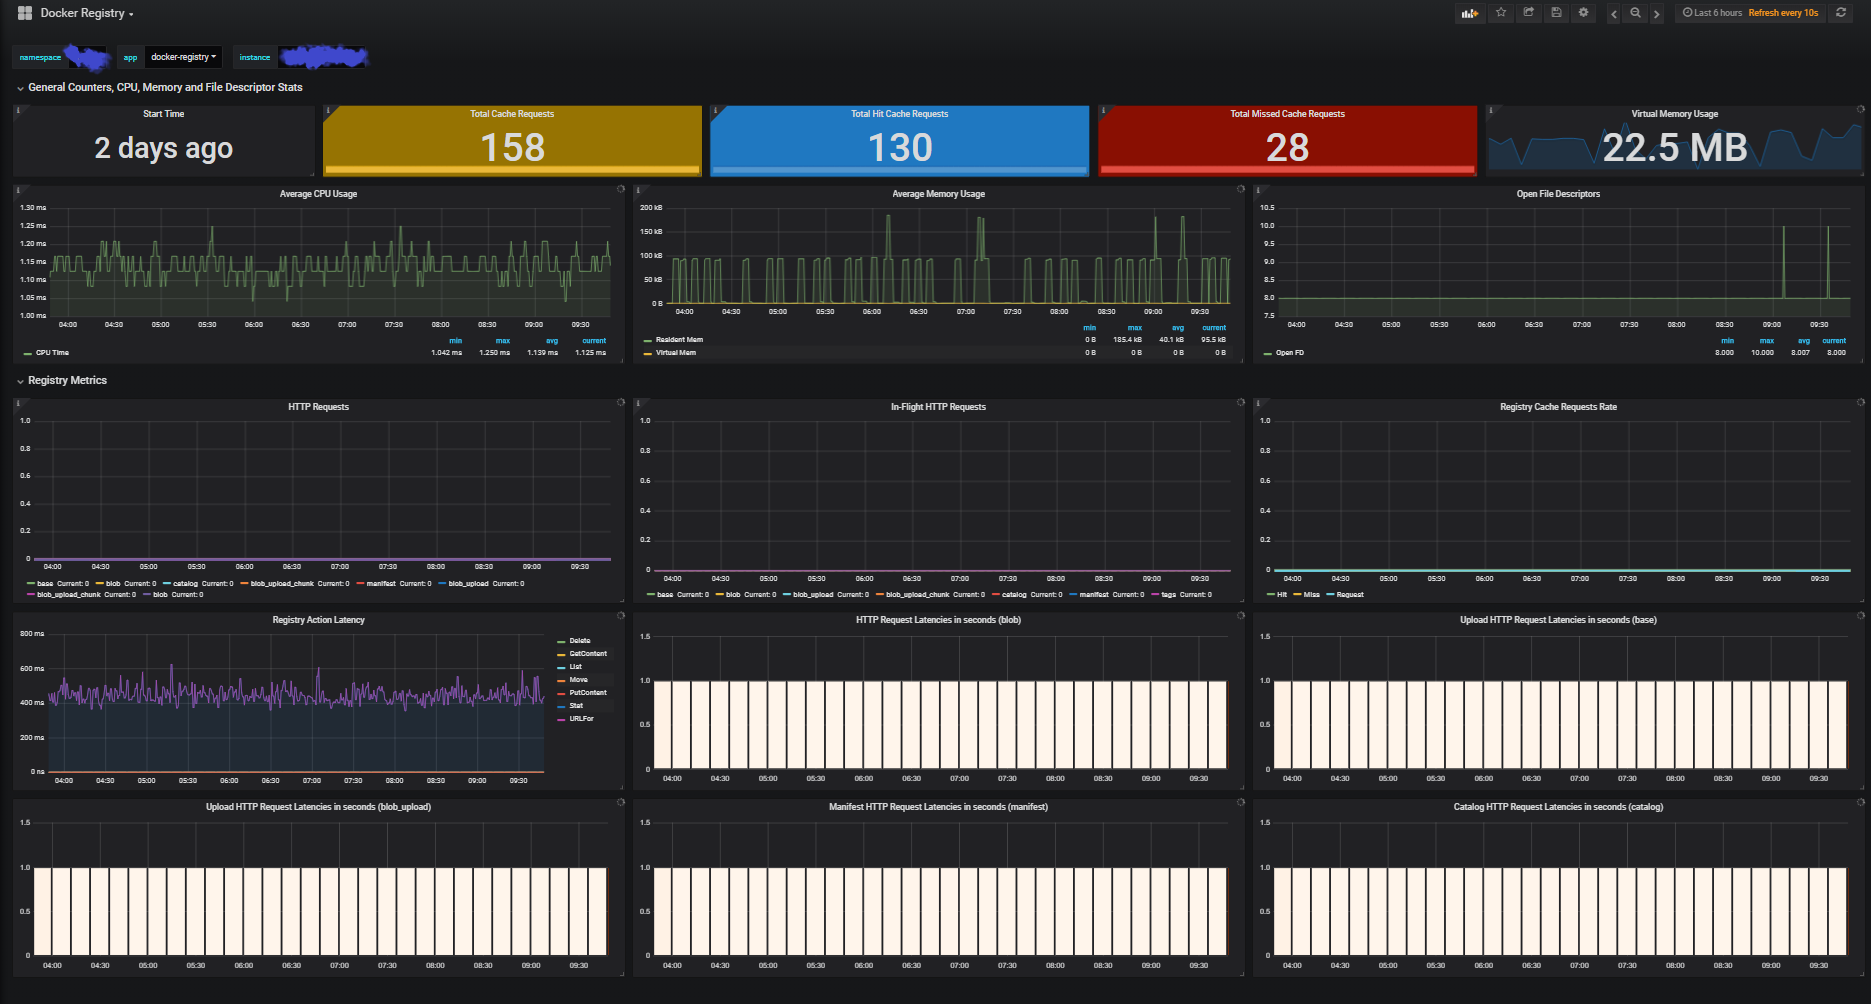
This dashboard monitors the performance and resource usage of a Docker Registry, aggregating server metrics such as CPU/memory usage, open file descriptors, and HTTP request activity to provide end-to-end visibility of registry operations. It highlights key metrics like process_start_time_seconds and registry_http_requests_total alongside latency breakdowns for various endpoints (e.g., blob, manifest, catalog) and cache efficiency through registry_storage_cache_total and registry_storage_action_seconds_sum to identify bottlenecks and capacity trends.
Screenshots
Used Metrics 1010
-
process_cpu_seconds_total
-
process_open_fds
-
process_resident_memory_bytes
-
process_start_time_seconds
-
process_virtual_memory_bytes
registry_http_in_flight_requests
registry_http_request_duration_seconds_bucket
registry_http_requests_total
registry_storage_action_seconds_sum
registry_storage_cache_total