ElasticSearch 41,77941,779 5.0 (1 reviews)
Description
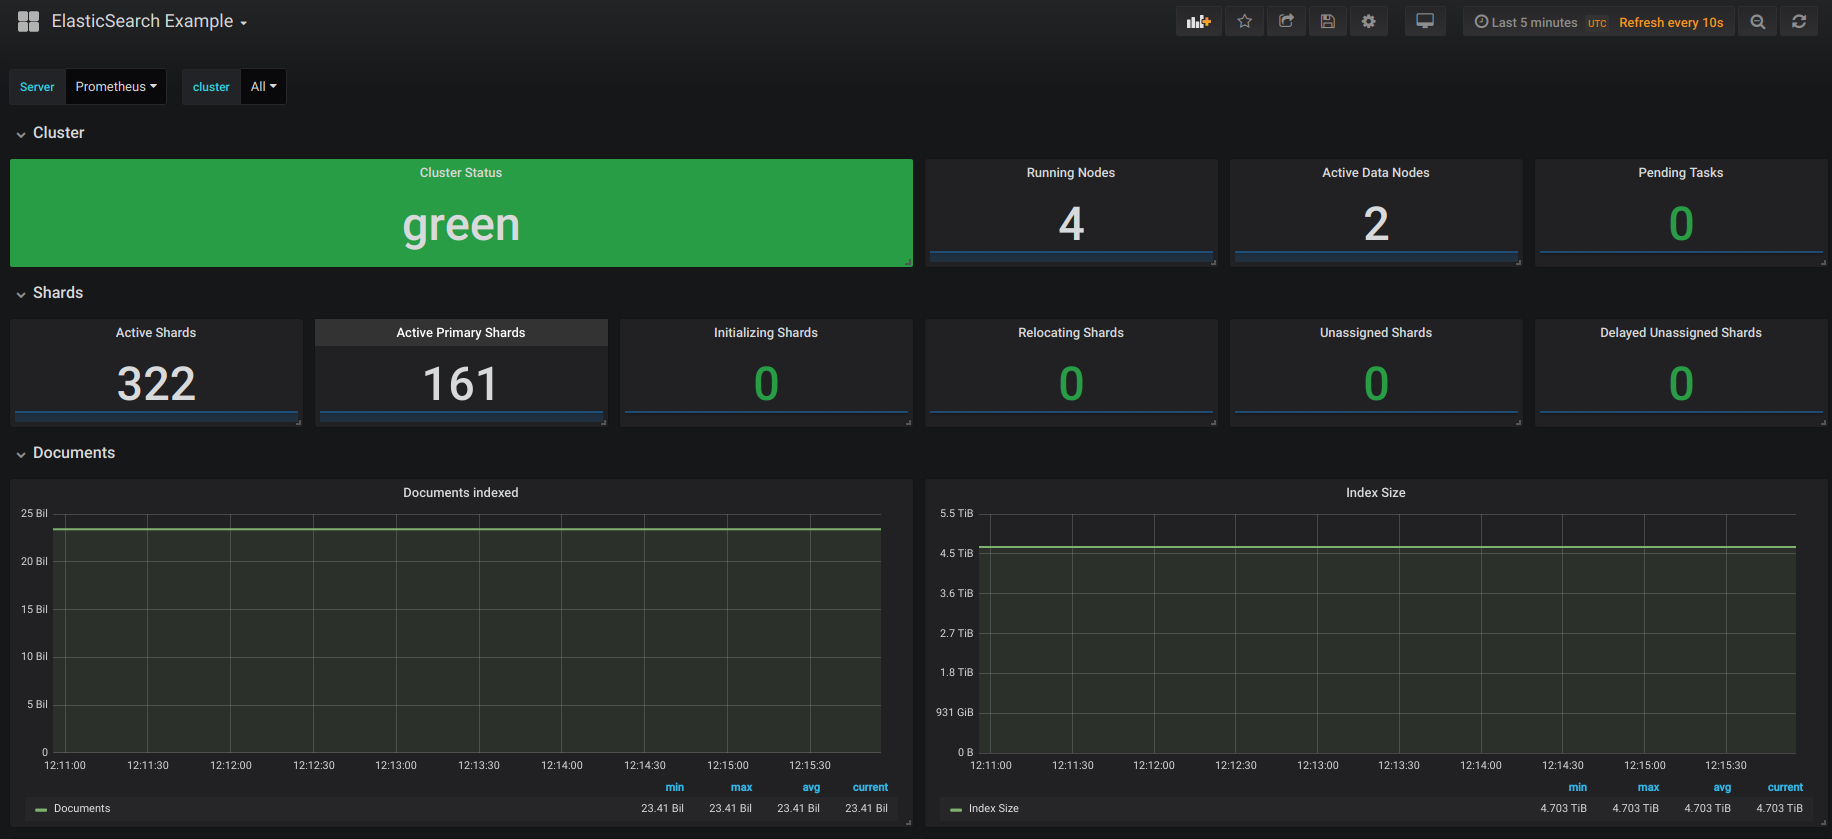
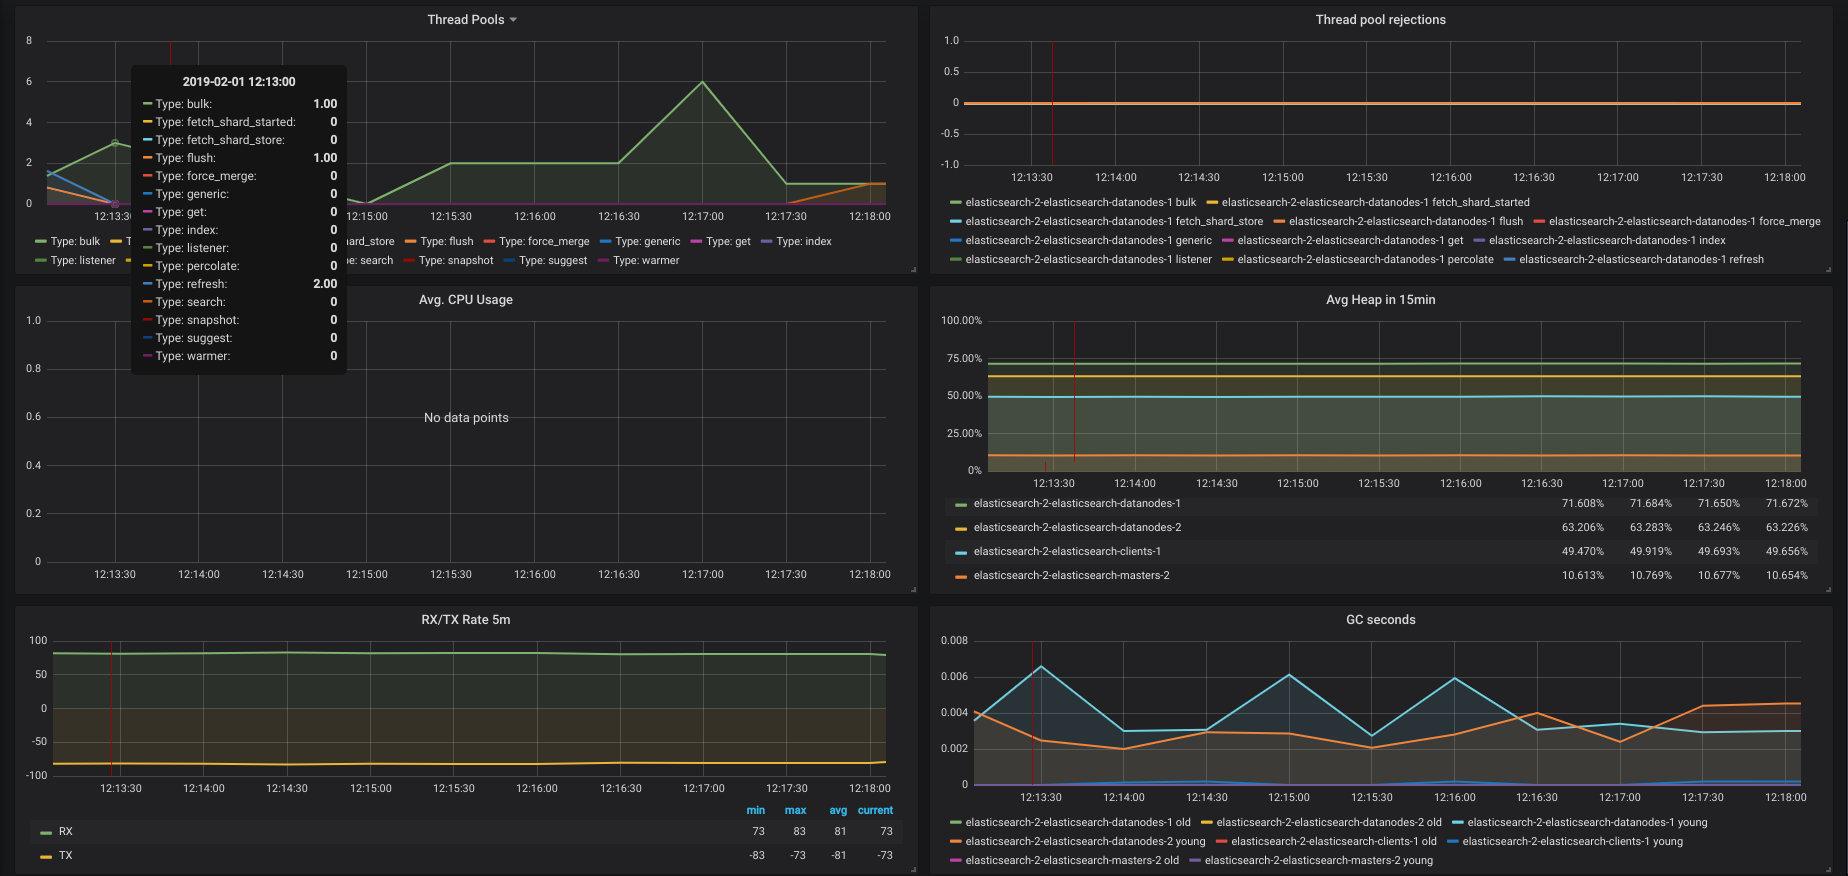
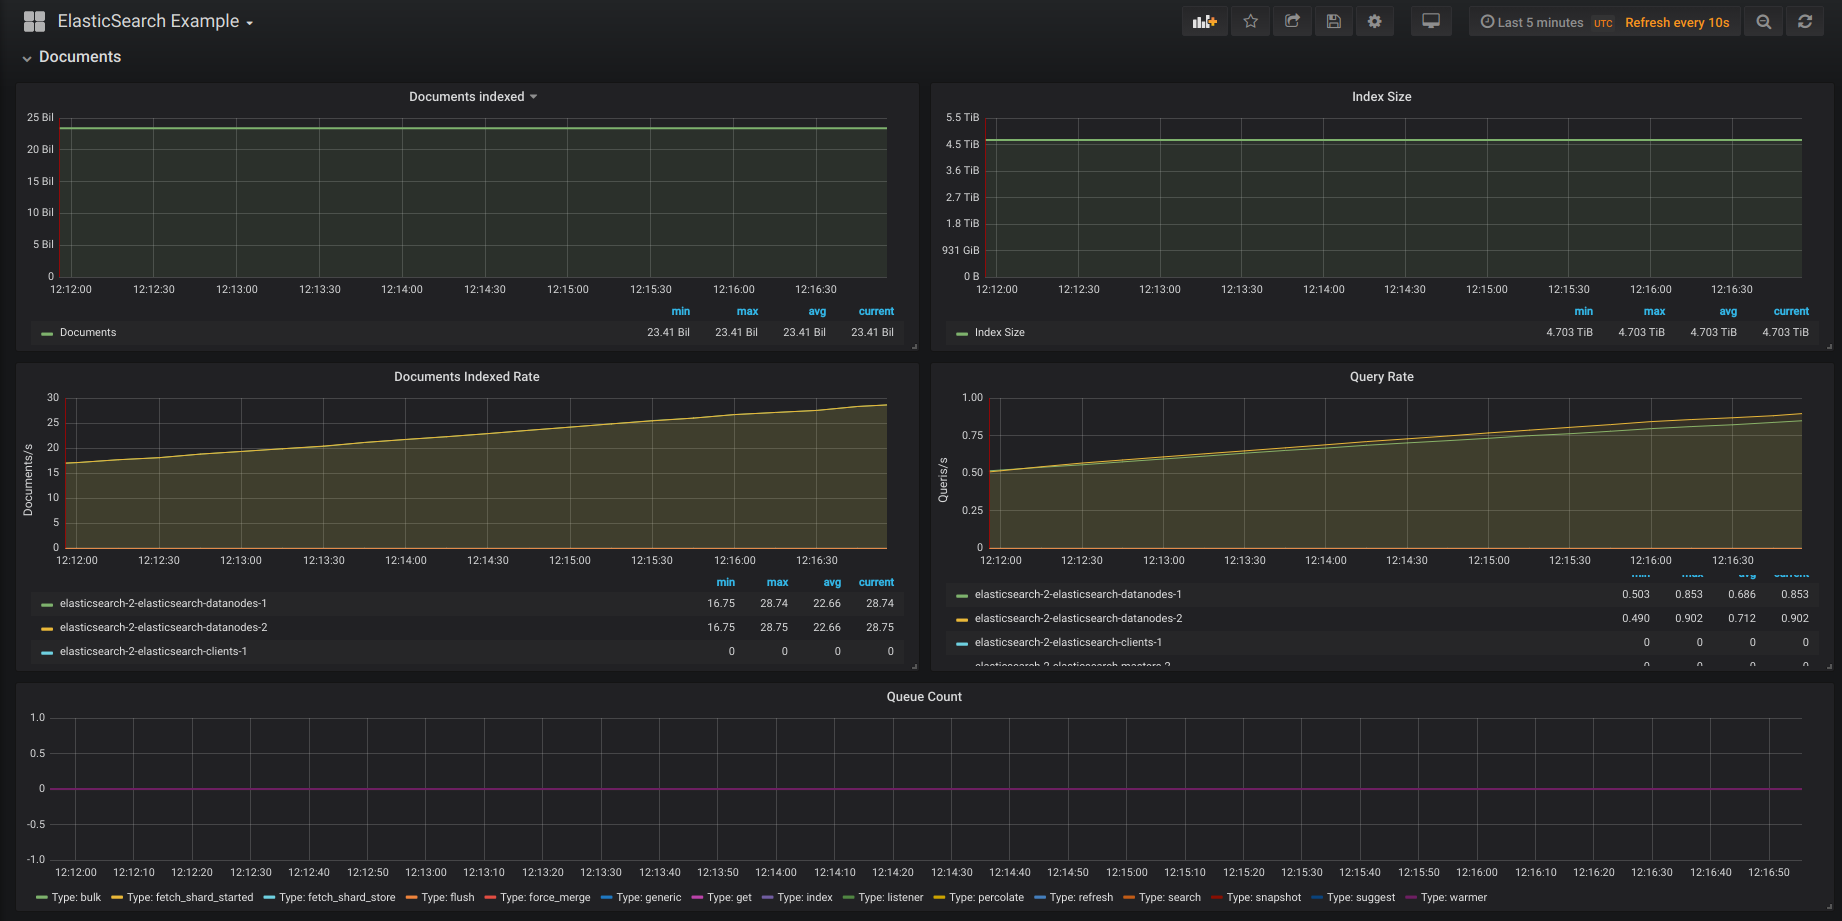
This dashboard monitors the health and capacity of an Elasticsearch cluster, visualizing critical state metrics and resource utilization to quickly assess cluster stability and performance. It emphasizes core health signals such as elasticsearch_cluster_health_status, elasticsearch_cluster_health_number_of_nodes, and elasticsearch_cluster_health_active_shards to surface overall health, size, and shard activity, while also presenting operational indicators like memory usage and thread pool metrics. Key features include a concise view of cluster status, shard distribution (active/initializing/relocating/unassigned), and historical rate metrics for documents indexed and queries per second to track capacity and throughput.
Screenshots
Used Metrics 2626
-
elasticsearch_cluster_health_active_primary_shards
-
elasticsearch_cluster_health_active_shards
-
elasticsearch_cluster_health_delayed_unassigned_shards
-
elasticsearch_cluster_health_initializing_shards
-
elasticsearch_cluster_health_number_of_data_nodes
-
elasticsearch_cluster_health_number_of_nodes
-
elasticsearch_cluster_health_number_of_pending_tasks
-
elasticsearch_cluster_health_relocating_shards
-
elasticsearch_cluster_health_status
-
elasticsearch_cluster_health_unassigned_shards
-
elasticsearch_indices_docs
-
elasticsearch_indices_indexing_index_total
-
elasticsearch_indices_search_fetch_total
-
elasticsearch_indices_store_size_bytes
-
elasticsearch_jvm_gc_collection_seconds_sum
-
elasticsearch_jvm_memory_max_bytes
-
elasticsearch_jvm_memory_used_bytes
-
elasticsearch_thread_pool_active_count
-
elasticsearch_thread_pool_queue_count
-
elasticsearch_thread_pool_rejected_count
-
elasticsearch_transport_rx_packets_total
-
elasticsearch_transport_tx_packets_total
node_cpu
node_memory_MemAvailable
node_memory_MemFree
node_memory_MemTotal