Elasticsearch Exporter Quickstart and Dashboard 7,691,7557,691,755 4.3 (3 reviews)
Description
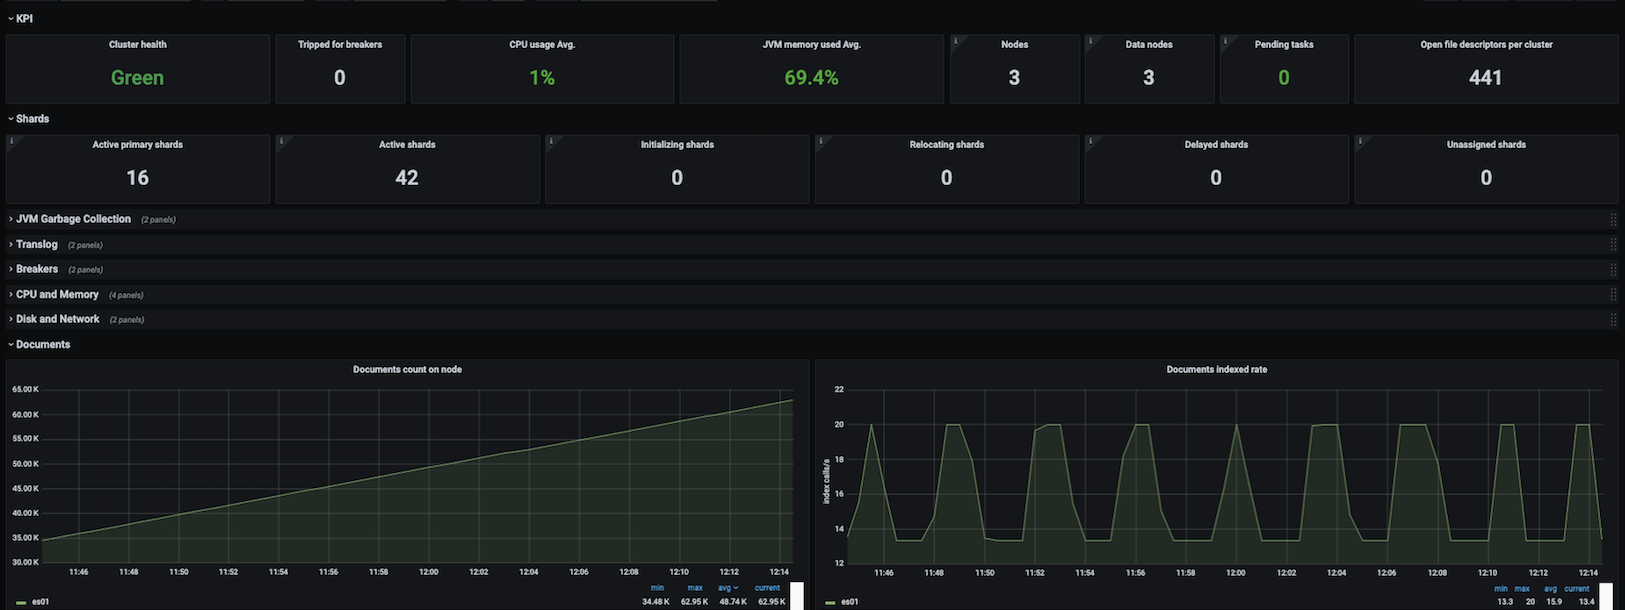
This dashboard monitors the health and performance of an Elasticsearch cluster with a focus on operational health, resource usage, and index activity. It highlights key indicators such as elasticsearch_cluster_health_status, elasticsearch_process_cpu_percent, and elasticsearch_jvm_memory_used_bytes to track cluster stability, CPU load, and memory pressure, while panels like Active shards, Active primary shards, and Nodes provide a quick read on shard distribution and node availability. Additional context includes metrics for file descriptors, pending tasks, and open files to help diagnose bottlenecks and potential scaling needs.
Screenshots
Used Metrics 2525
-
elasticsearch_breakers_tripped
-
elasticsearch_cluster_health_active_primary_shards
-
elasticsearch_cluster_health_active_shards
-
elasticsearch_cluster_health_delayed_unassigned_shards
-
elasticsearch_cluster_health_initializing_shards
-
elasticsearch_cluster_health_number_of_data_nodes
-
elasticsearch_cluster_health_number_of_nodes
-
elasticsearch_cluster_health_number_of_pending_tasks
-
elasticsearch_cluster_health_relocating_shards
-
elasticsearch_cluster_health_status
-
elasticsearch_cluster_health_unassigned_shards
-
elasticsearch_indices_docs
-
elasticsearch_indices_docs_deleted
-
elasticsearch_indices_indexing_index_total
-
elasticsearch_indices_merges_docs_total
-
elasticsearch_indices_merges_total_size_bytes_total
-
elasticsearch_jvm_memory_committed_bytes
-
elasticsearch_jvm_memory_max_bytes
-
elasticsearch_jvm_memory_pool_peak_used_bytes
-
elasticsearch_jvm_memory_used_bytes
-
elasticsearch_os_load1
-
elasticsearch_os_load15
-
elasticsearch_os_load5
-
elasticsearch_process_cpu_percent
-
elasticsearch_process_open_files_count