EMQX 11,25211,252 5.0 (1 reviews)
Description
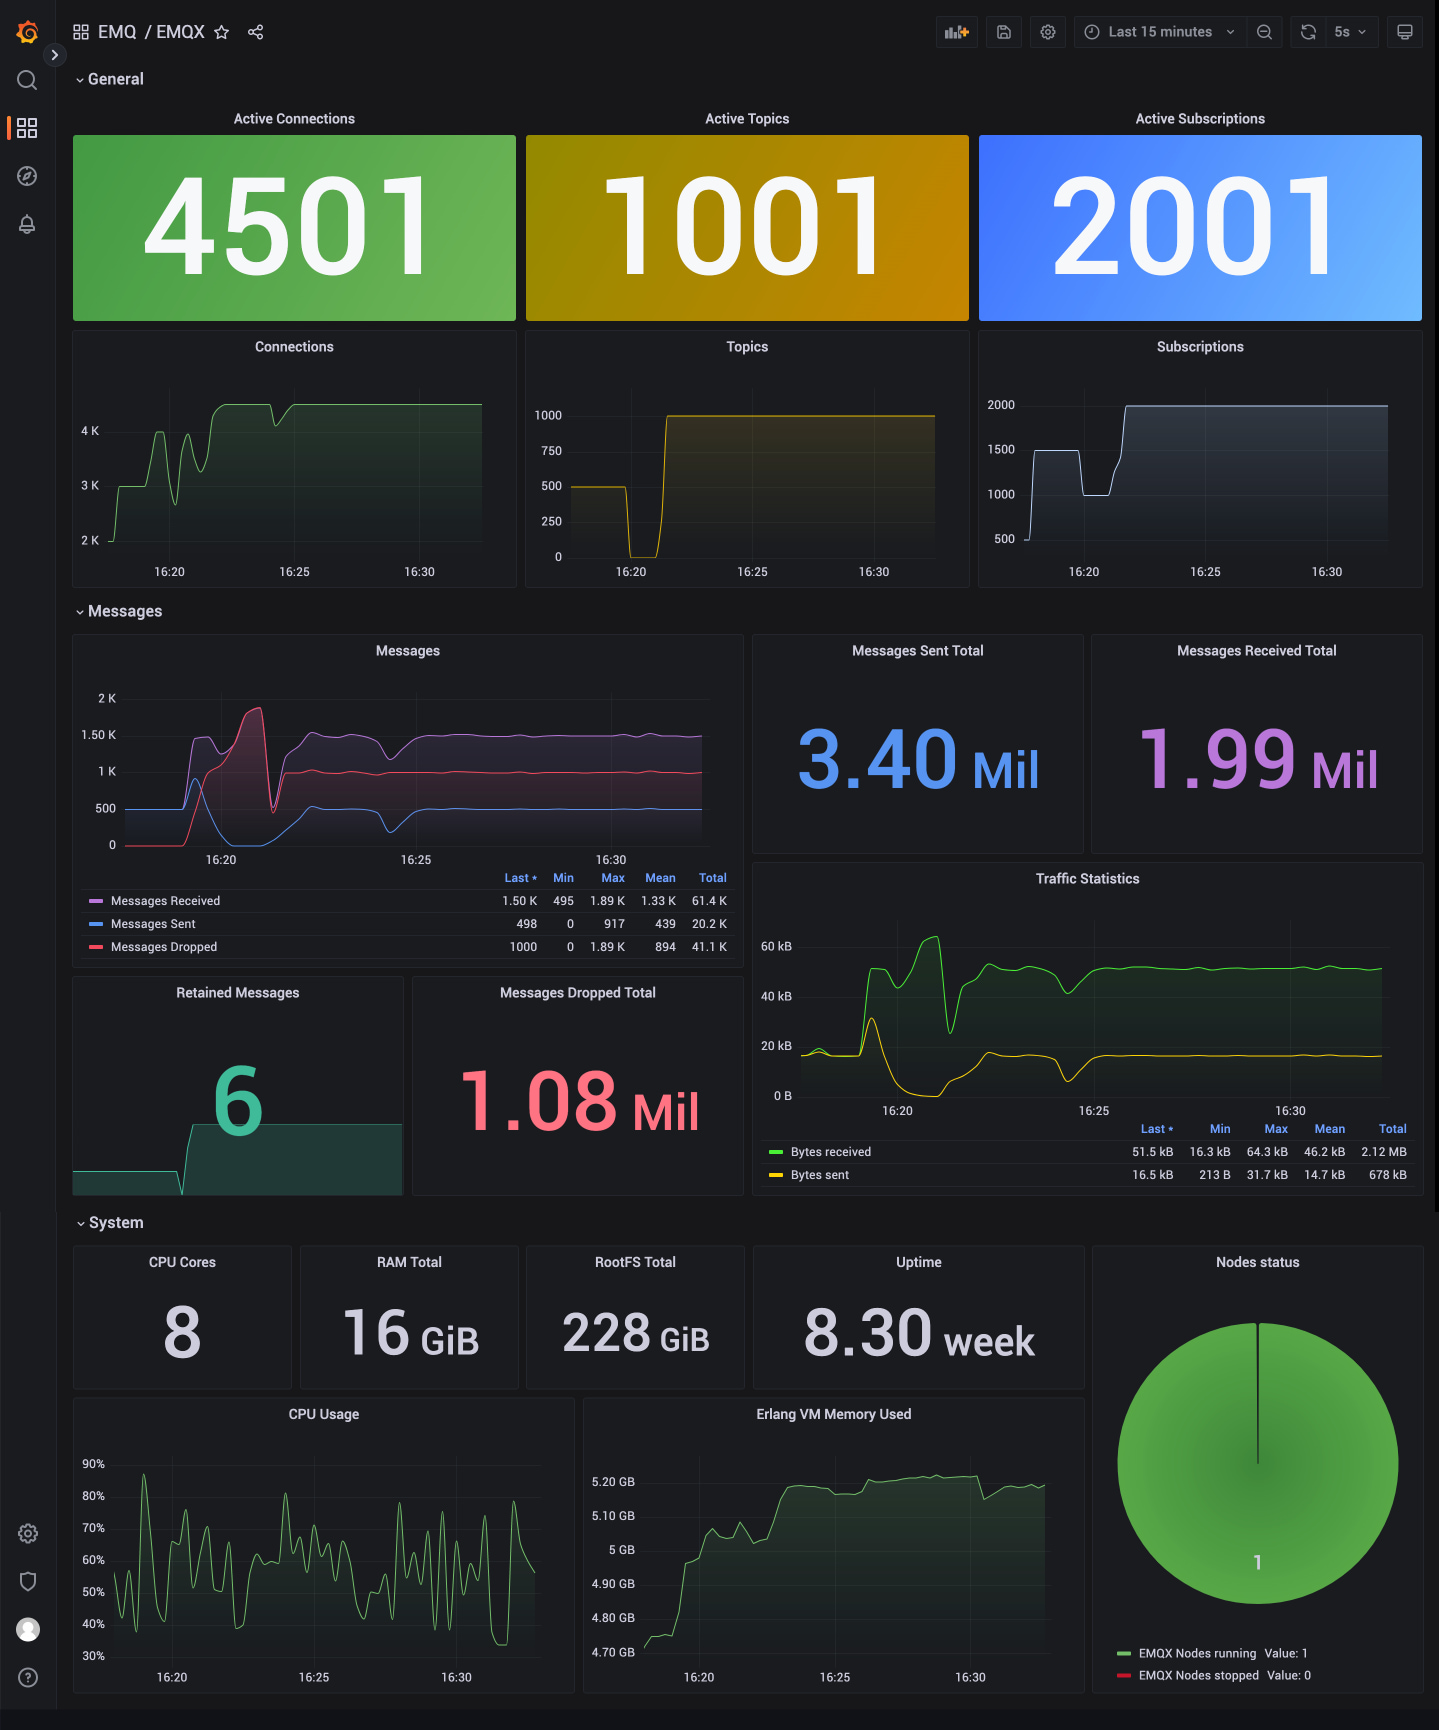
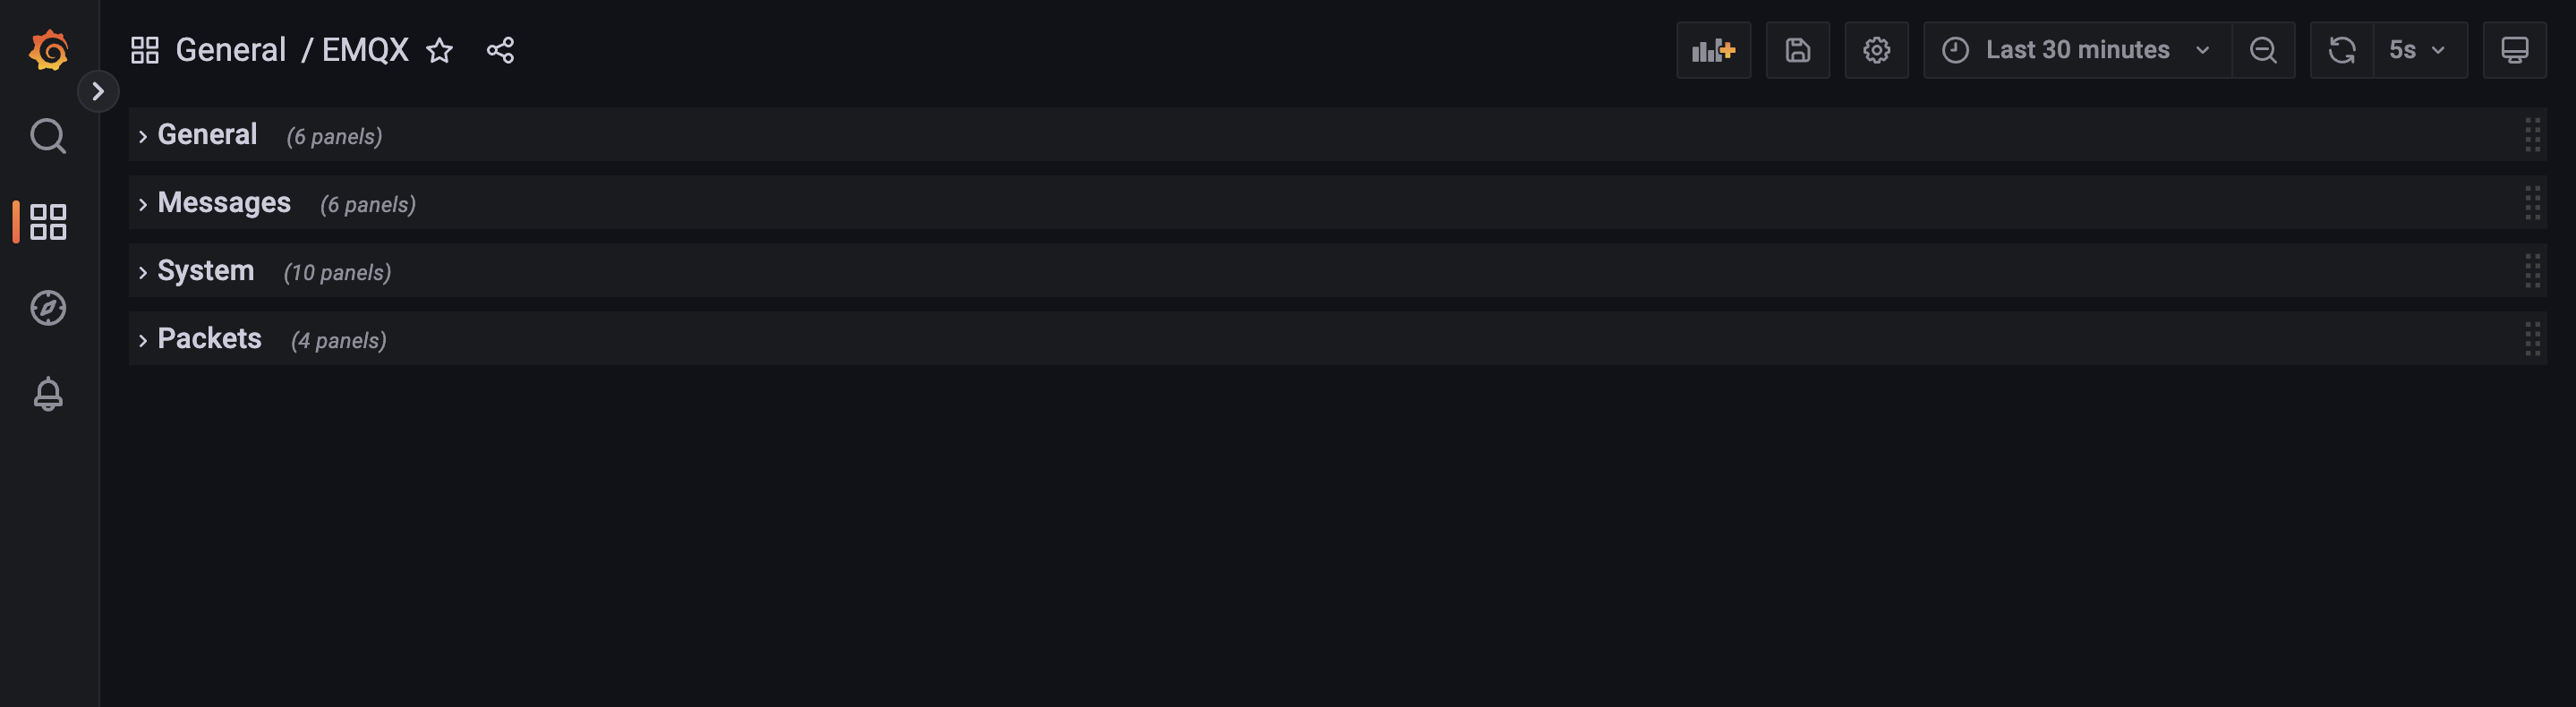
Default EMQX 5.0 Grafana Monitoring Dashboard Template
Screenshots
Used Metrics 3636
emqx_bytes_received
emqx_bytes_sent
emqx_cluster_nodes_running
emqx_cluster_nodes_stopped
emqx_connections_count
emqx_messages_dropped
emqx_messages_received
emqx_messages_sent
emqx_packets_connack_error
emqx_packets_connack_sent
emqx_packets_connect
emqx_packets_disconnect_received
emqx_packets_disconnect_sent
emqx_packets_publish_dropped
emqx_packets_publish_error
emqx_packets_publish_received
emqx_packets_publish_sent
emqx_packets_suback_sent
emqx_packets_subscribe_error
emqx_packets_subscribe_received
emqx_packets_unsubscribe_error
emqx_packets_unsubscribe_received
emqx_retained_count
emqx_suboptions_count
emqx_topics_count
emqx_vm_used_memory
erlang_mnesia_memory_usage_bytes
erlang_vm_process_count
erlang_vm_statistics_run_queues_length_total
erlang_vm_thread_pool_size
erlang_vm_threads
-
node_boot_time_seconds
-
node_cpu_seconds_total
-
node_filesystem_size_bytes
node_memory_total_bytes
-
node_time_seconds