Erlang-Distribution 33,461,65533,461,655 3.0 (1 reviews)
Description
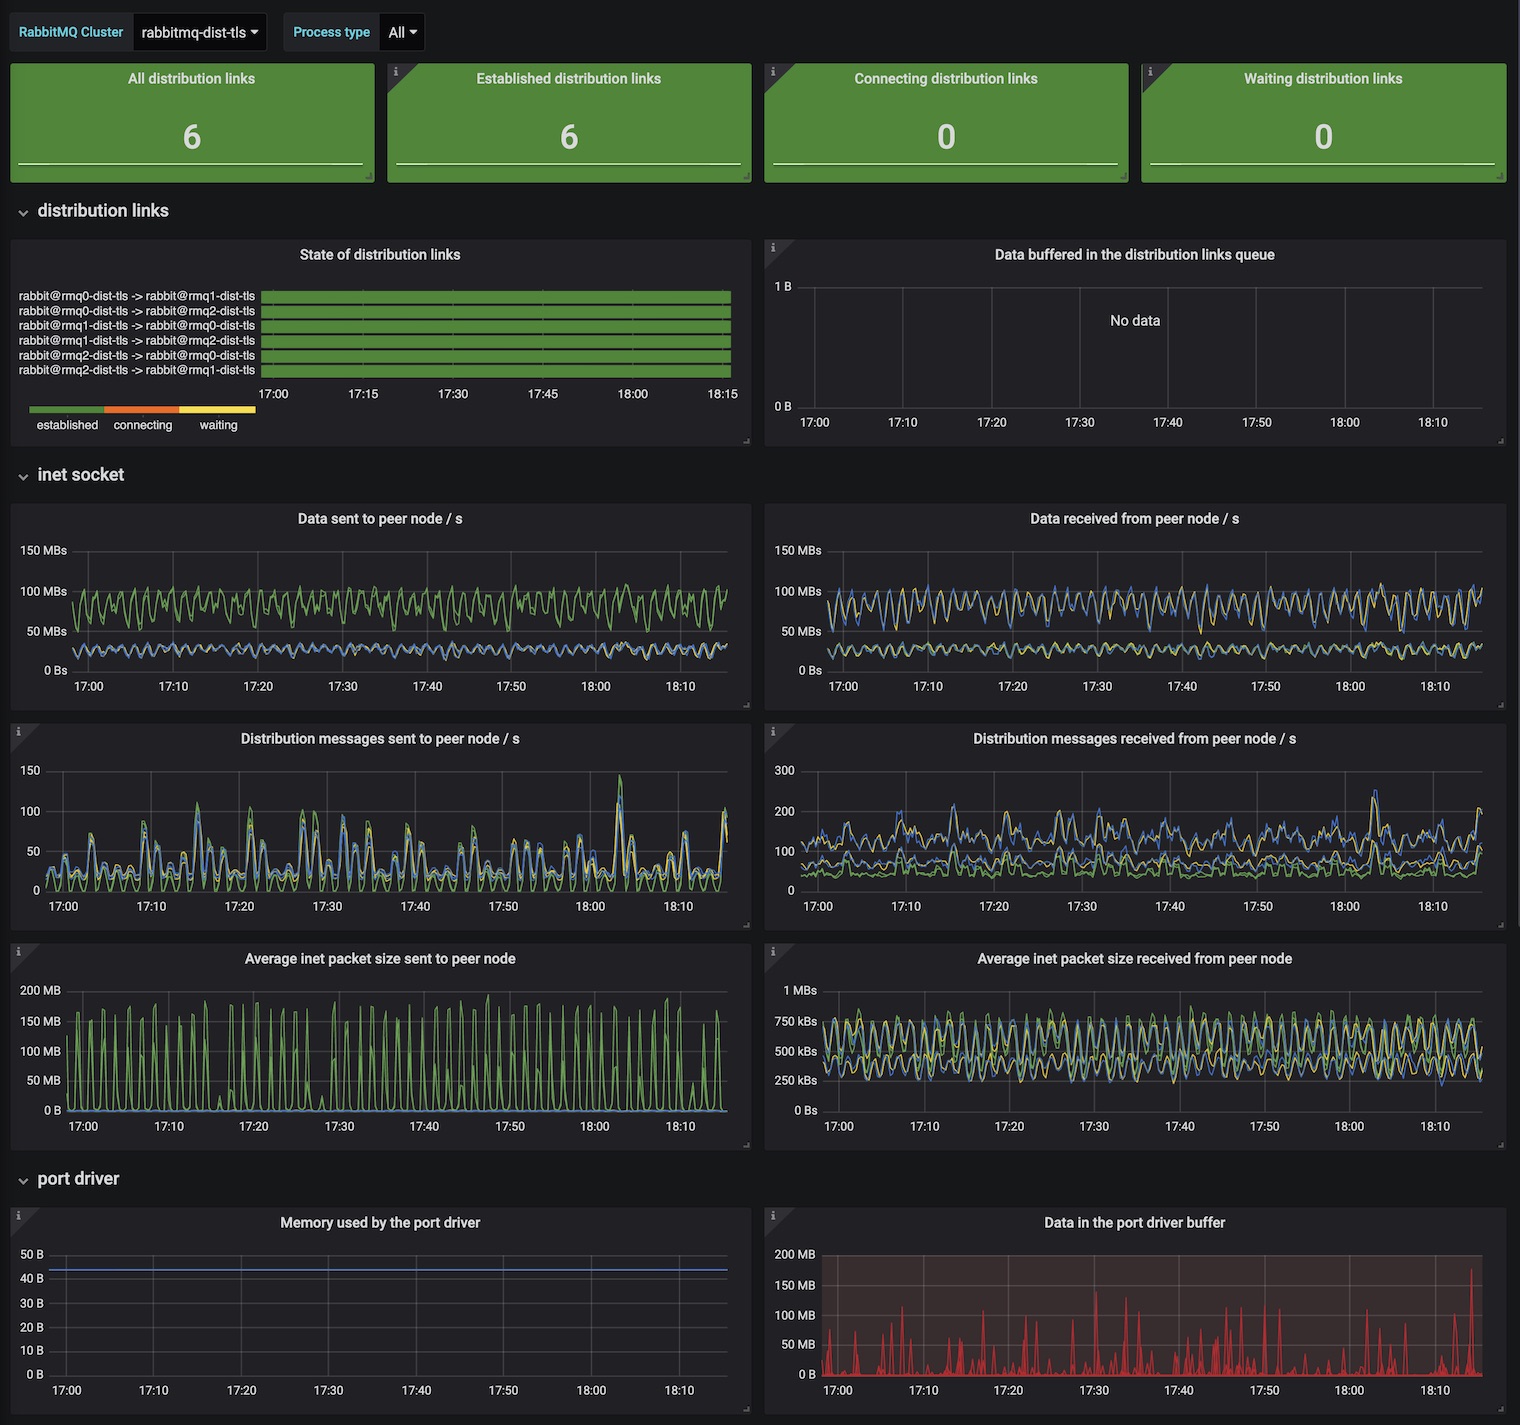
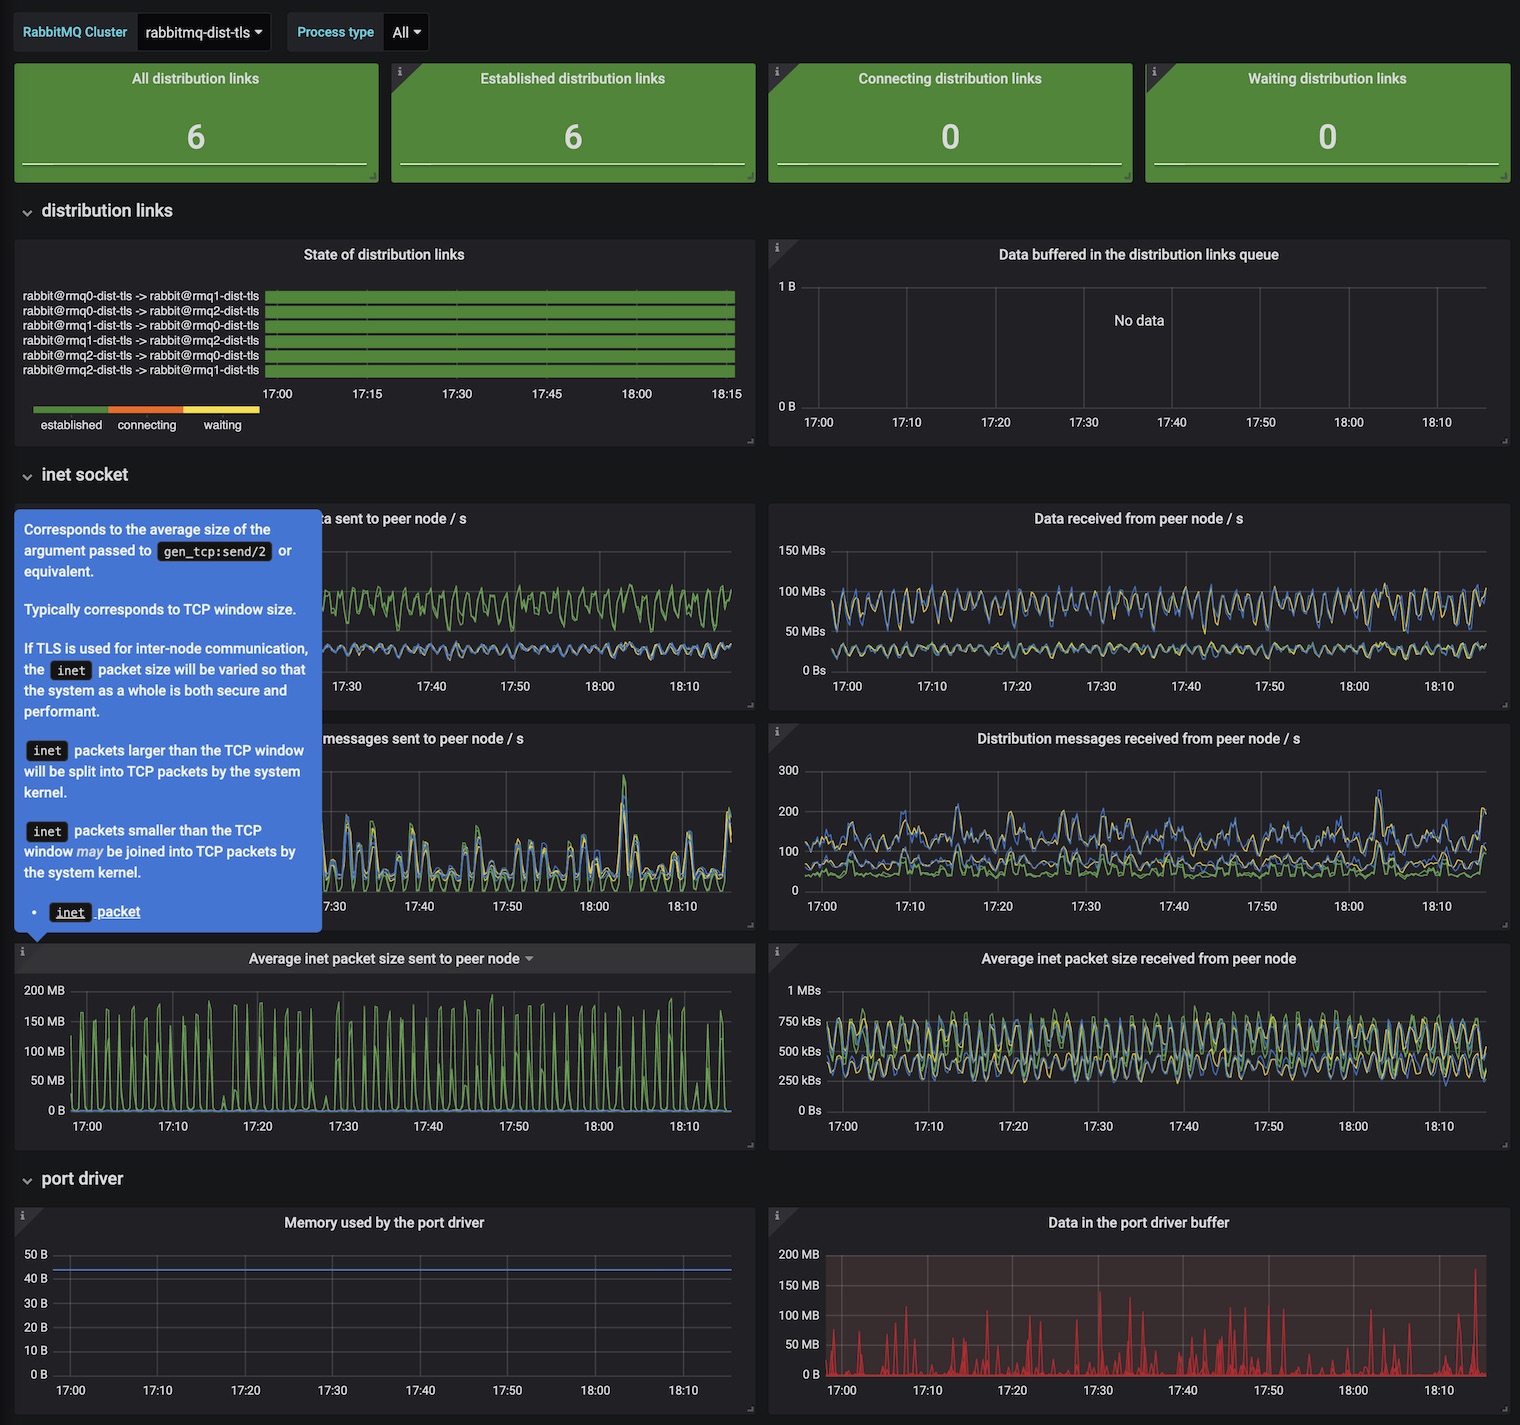
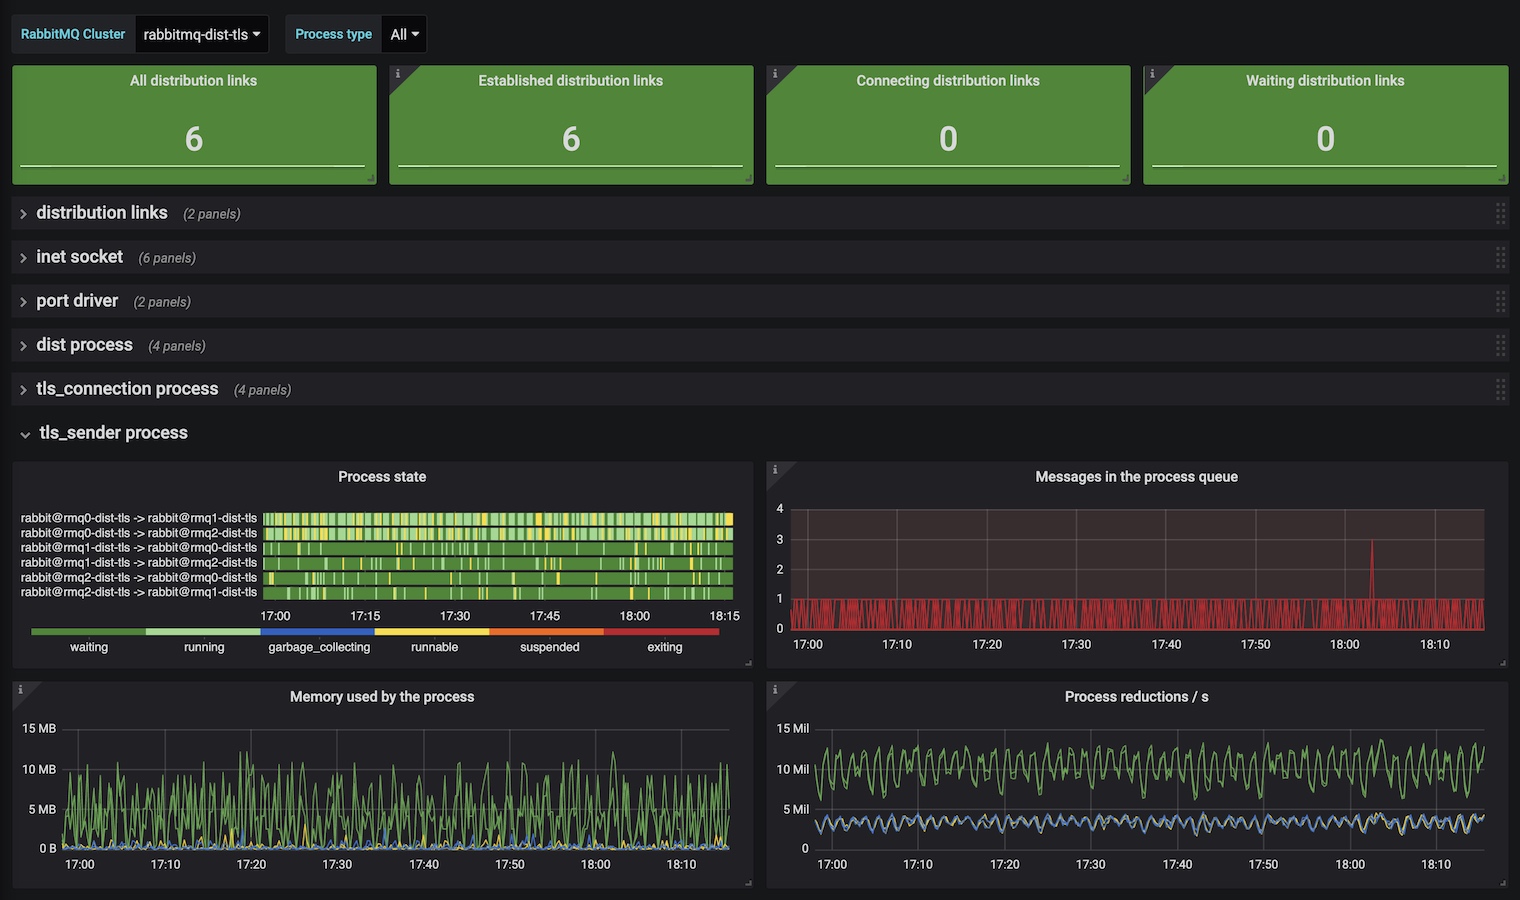
This dashboard monitors Erlang distribution links and related node-level resource and messaging behavior across the cluster, providing real-time visibility into link states (established, connecting, waiting), queued/buffered data, and throughput to peers. Key features include per-link and per-peer traffic rates and counts, buffer and port-driver memory usage, and process-level health indicators (process state, queue lengths, memory and reductions), enabling rapid diagnosis of inter-node communication problems and resource bottlenecks.
Screenshots
Used Metrics 1515
erlang_vm_dist_node_queue_size_bytes
erlang_vm_dist_node_state
erlang_vm_dist_port_memory_bytes
erlang_vm_dist_port_queue_size_bytes
erlang_vm_dist_proc_memory_bytes
erlang_vm_dist_proc_message_queue_len
erlang_vm_dist_proc_reductions
erlang_vm_dist_proc_status
erlang_vm_dist_recv_bytes
erlang_vm_dist_recv_cnt
erlang_vm_dist_send_bytes
erlang_vm_dist_send_cnt
rabbitmq_cluster
rabbitmq_identity_info
rabbitmq_node