Erlang-Memory-Allocators 35,832,80335,832,803 3.0 (1 reviews)
12/4/2019
4/17/2025
8
>=11.2.2
Prometheus
Description
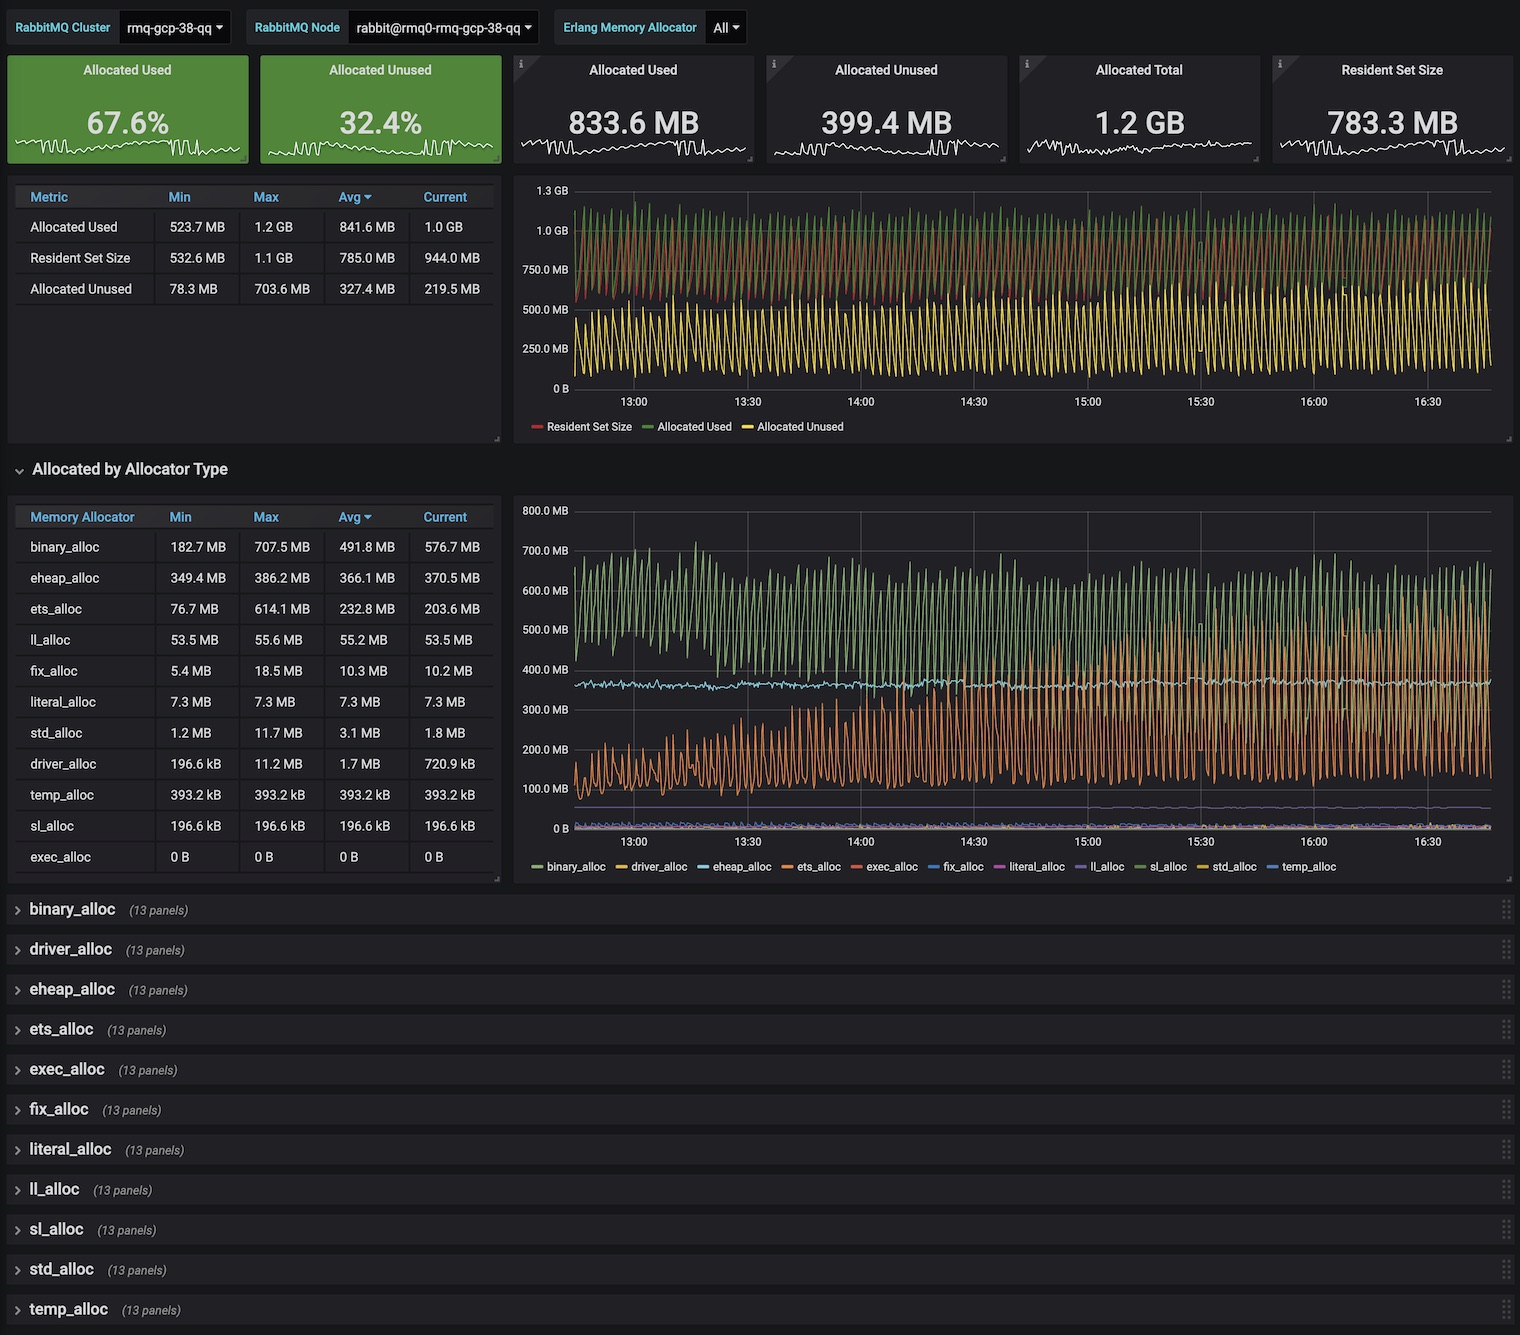
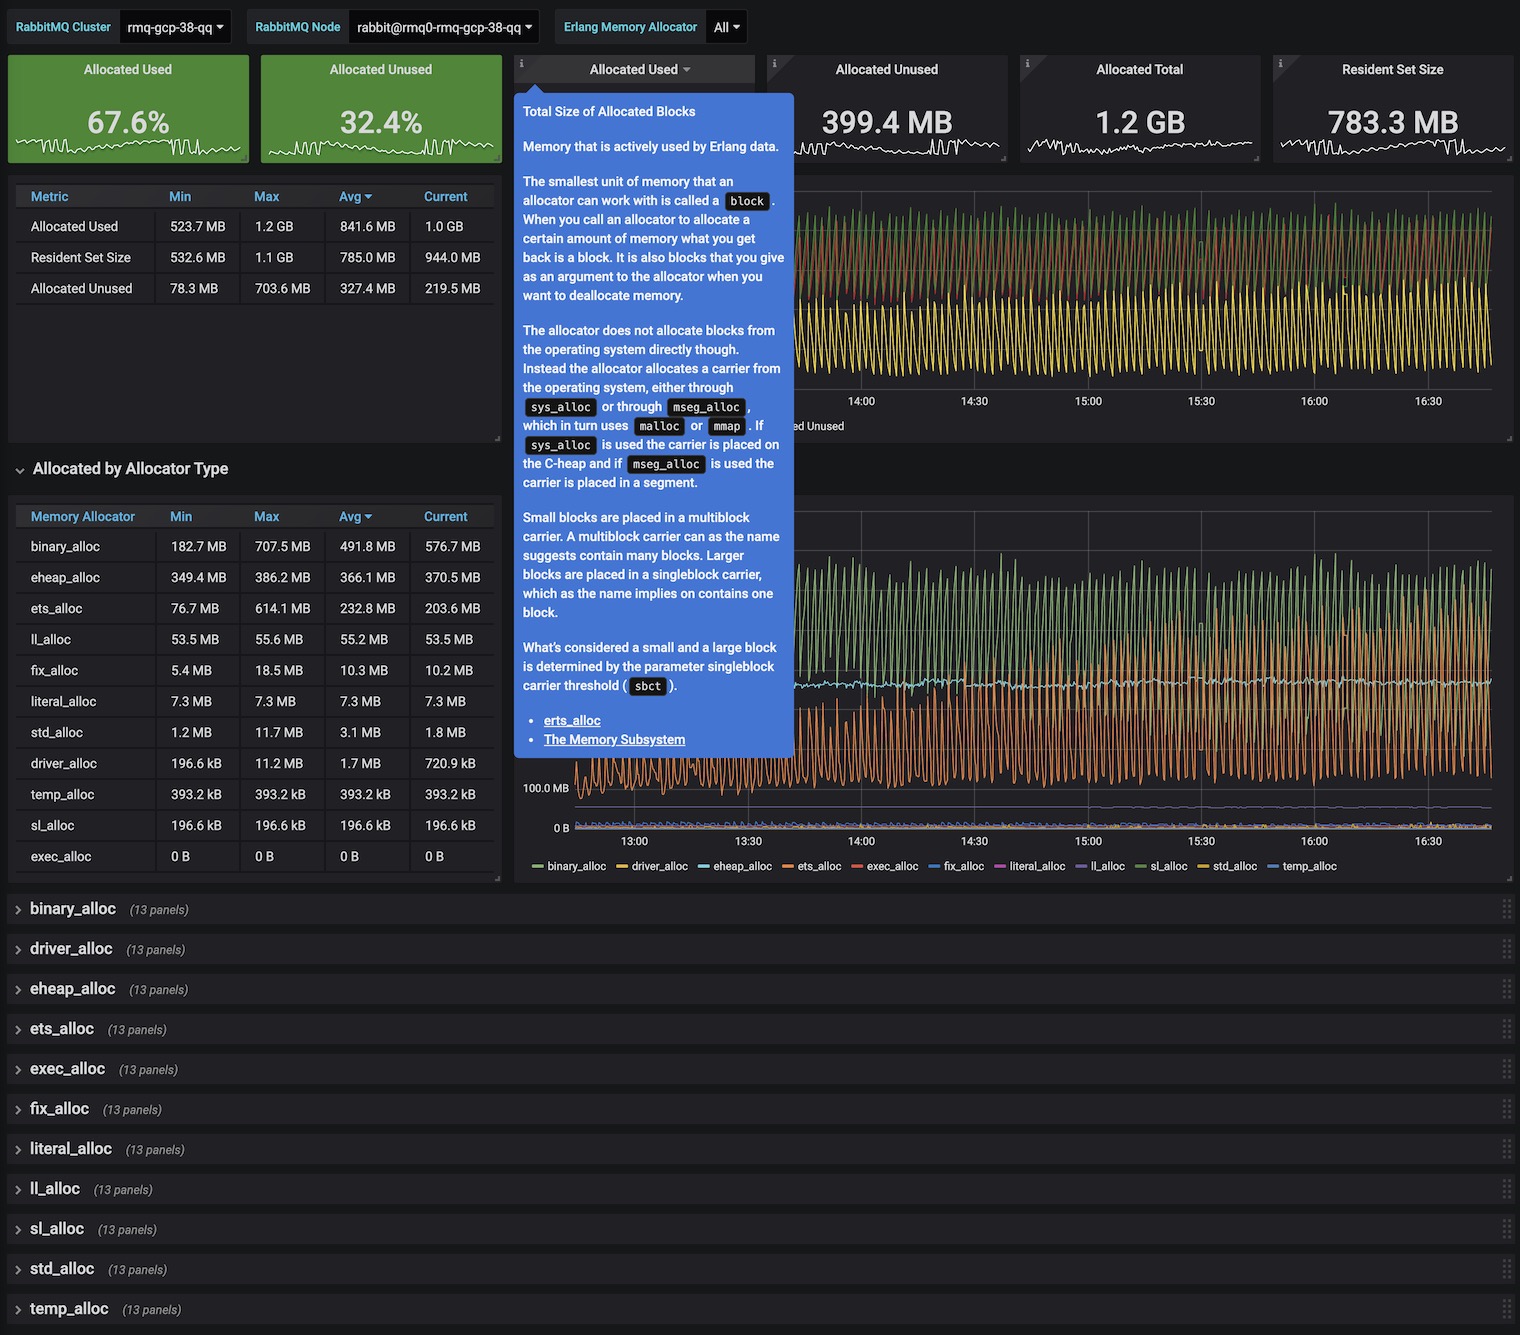
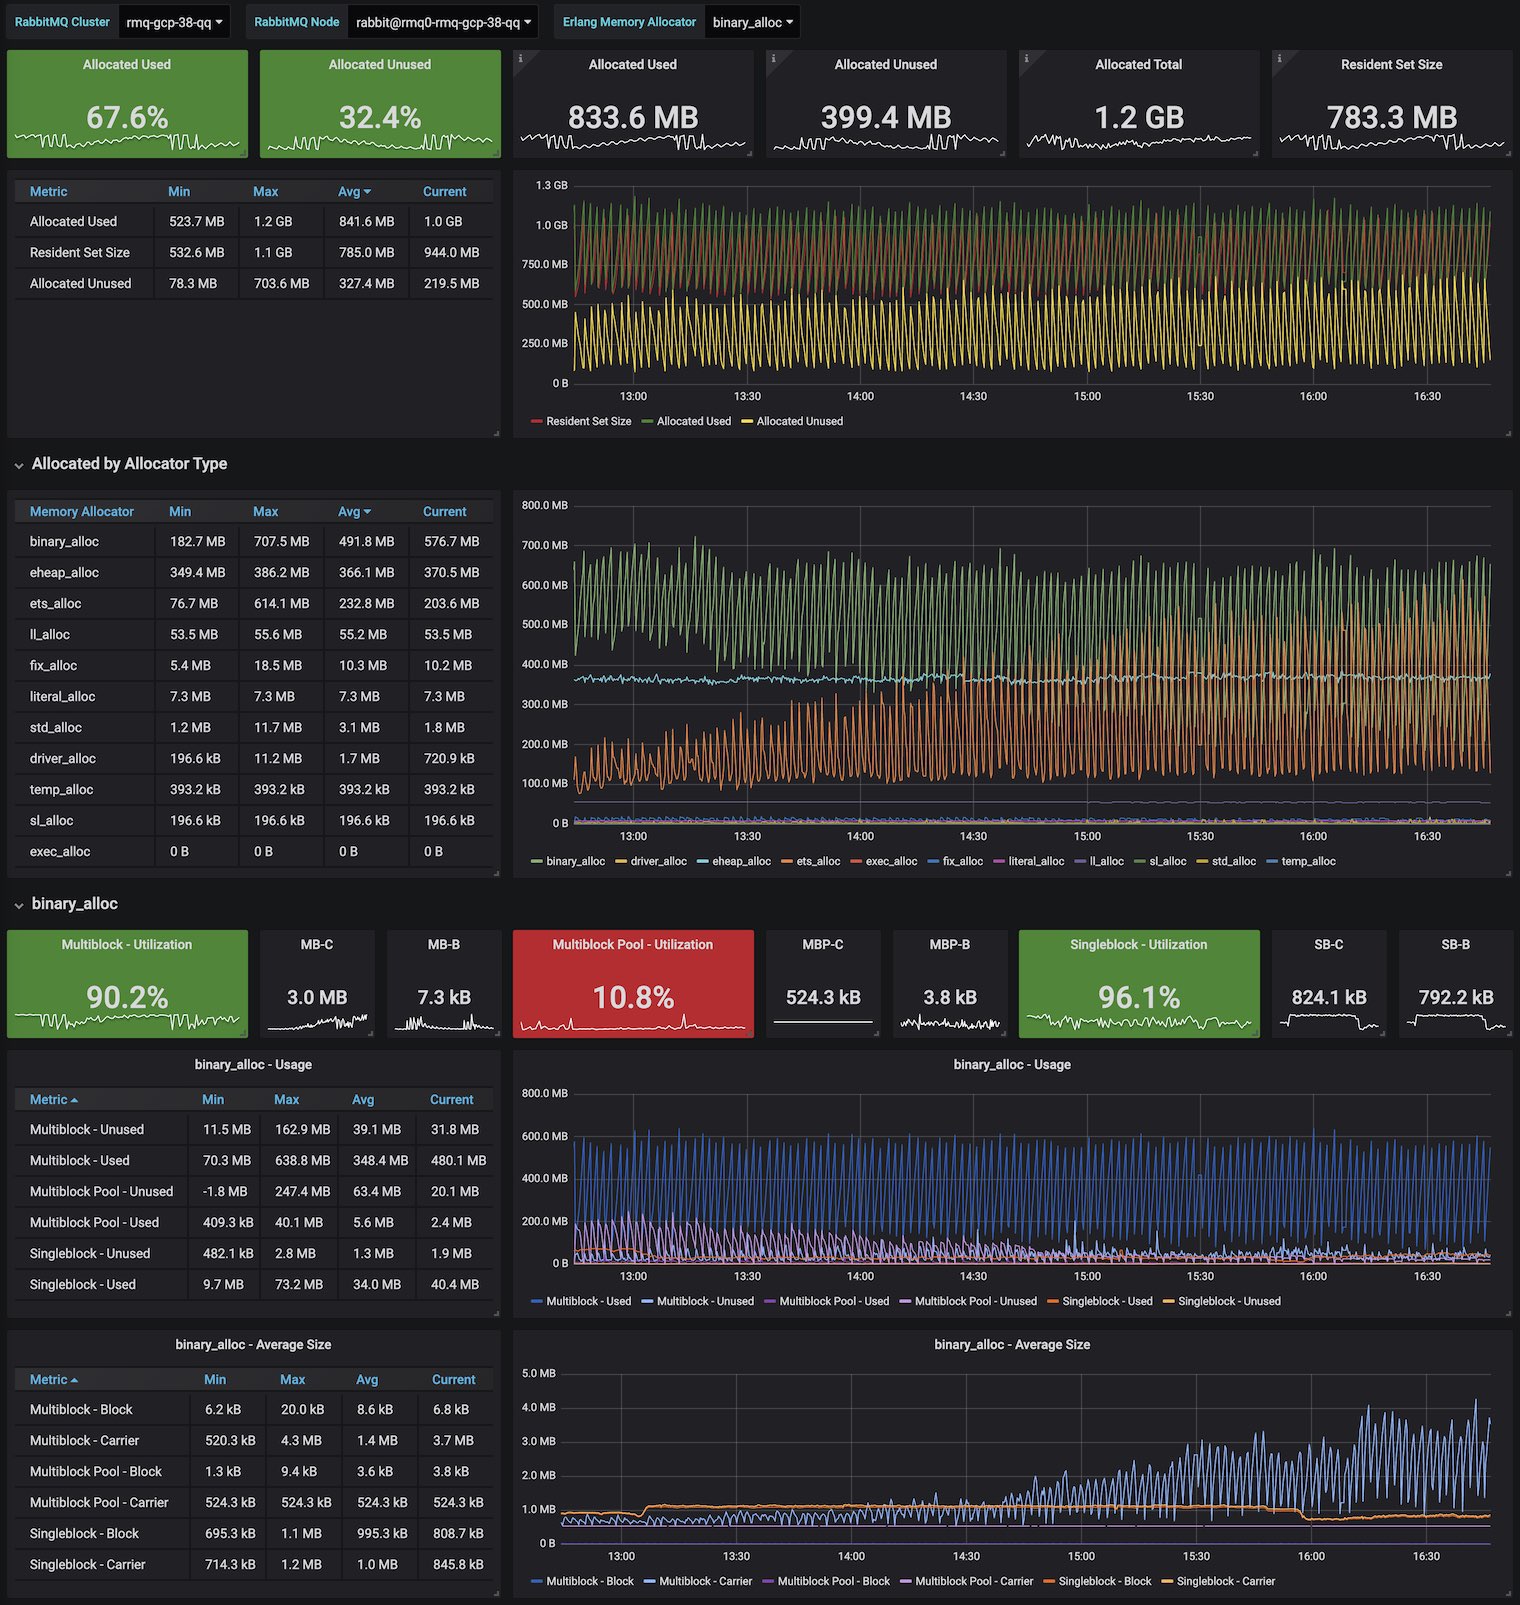
This dashboard monitors Erlang memory allocator behavior and node memory usage across a RabbitMQ cluster, showing allocated/unused memory, total allocation, and resident set size alongside per-allocator (multiblock/singleblock and pool variants) utilization and capacity. It provides quick identification of fragmentation, allocator pressure, and per-node anomalies to help diagnose memory leaks, inefficient allocation patterns, or node-level memory constraints in production environments.
Screenshots
Used Metrics 55
erlang_vm_allocators
rabbitmq_cluster
rabbitmq_identity_info
rabbitmq_node
rabbitmq_process_resident_memory_bytes
Get Dashboard✕
Download
Copy to Clipboard