Full Server Status 1,5581,558
Description
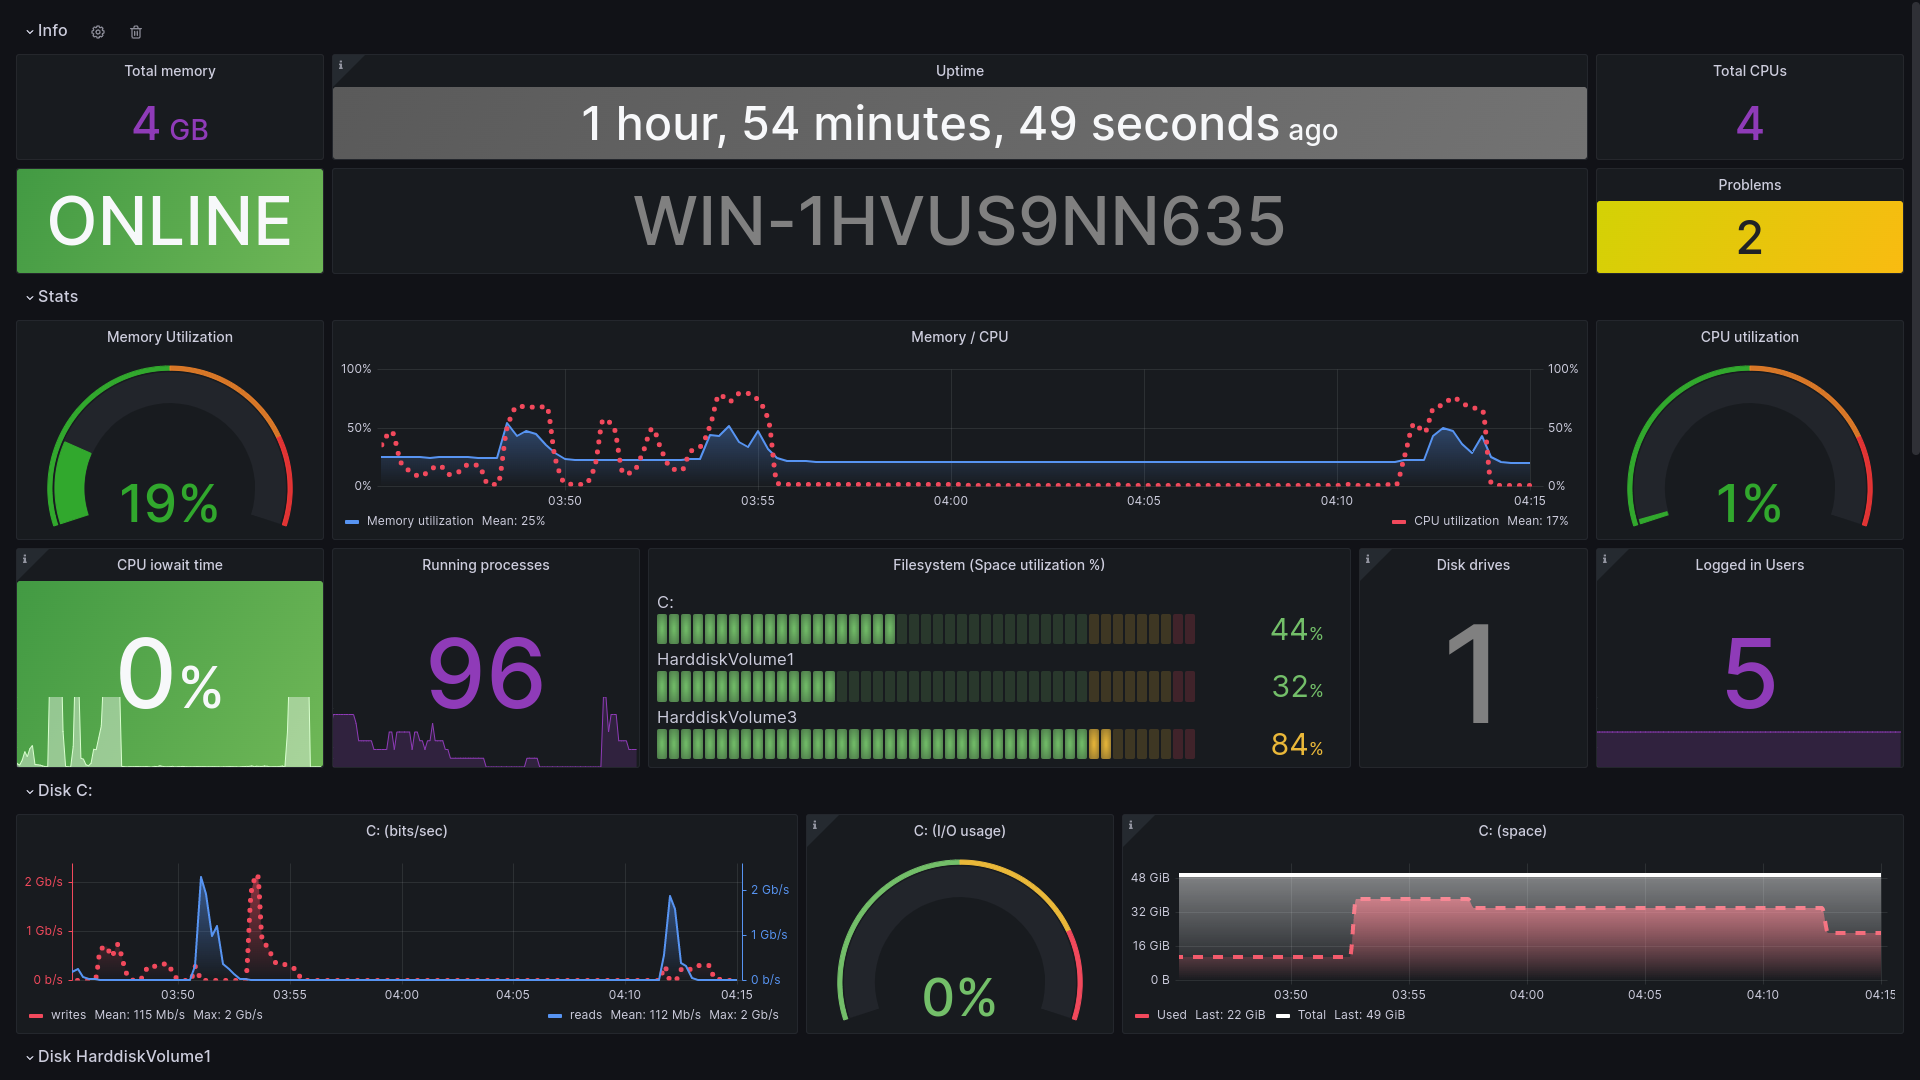
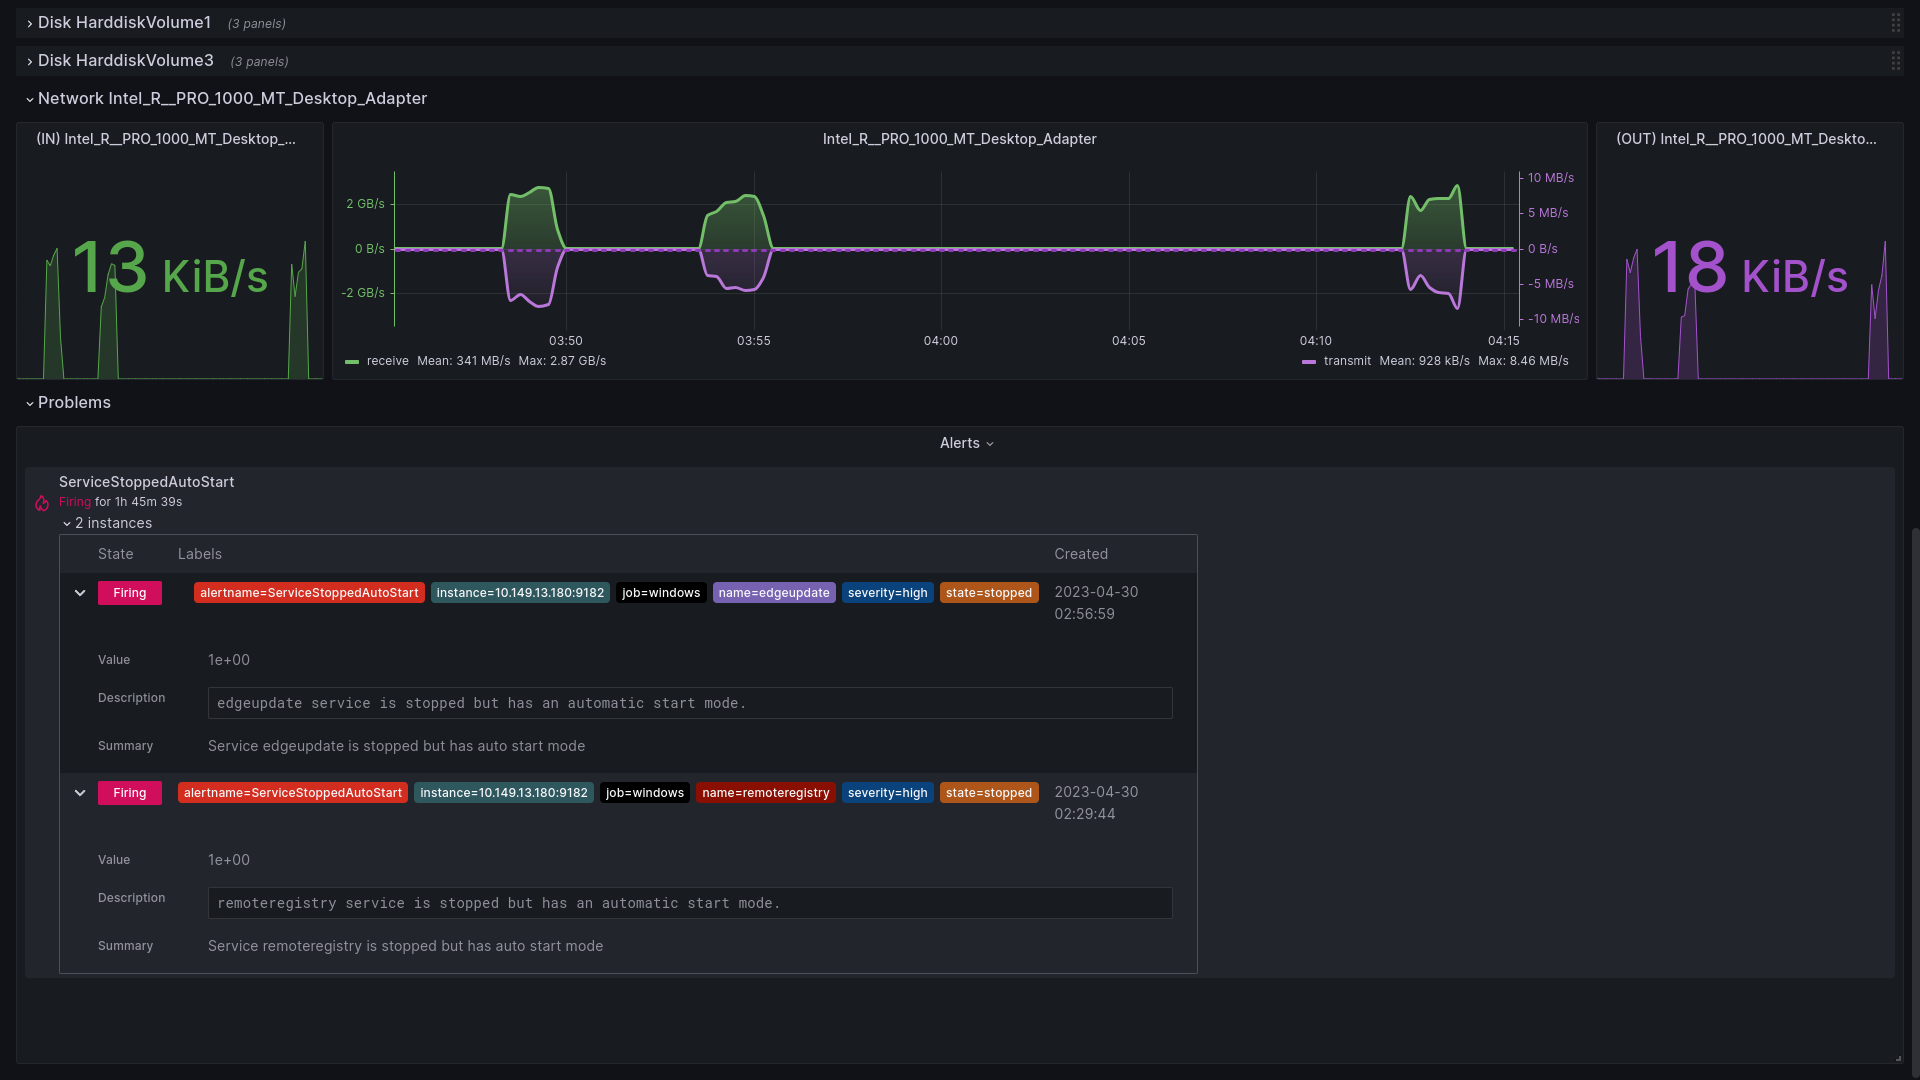
Simplify server monitoring with our Full Server Status dashboard. Track important metrics such as CPU and memory utilization, disk space usage, network traffic, and more in a single view.
Screenshots
Used Metrics 3535
ALERTS
-
node_boot_time_seconds
-
node_cpu_seconds_total
node_disk_info
-
node_disk_io_time_seconds_total
-
node_disk_read_bytes_total
-
node_disk_written_bytes_total
-
node_filesystem_avail_bytes
-
node_filesystem_free_bytes
-
node_filesystem_size_bytes
node_logind_sessions
-
node_memory_MemAvailable_bytes
-
node_memory_MemTotal_bytes
-
node_network_receive_bytes_total
-
node_network_transmit_bytes_total
-
node_procs_running
-
node_time_seconds
-
node_uname_info
-
up
windows_cpu_time_total
windows_cs_hostname
windows_cs_logical_processors
windows_cs_physical_memory_bytes
windows_disk_drive_info
windows_logical_disk_free_bytes
windows_logical_disk_idle_seconds_total
windows_logical_disk_read_bytes_total
windows_logical_disk_size_bytes
windows_logical_disk_write_bytes_total
windows_logon_logon_type
windows_net_bytes_received_total
windows_net_bytes_sent_total
windows_os_physical_memory_free_bytes
windows_os_processes
windows_system_system_up_time