Go Processes 4,323,9704,323,970 3.0 (1 reviews)
6/26/2018
6/26/2018
2
>=5.1.4
Prometheus
Description
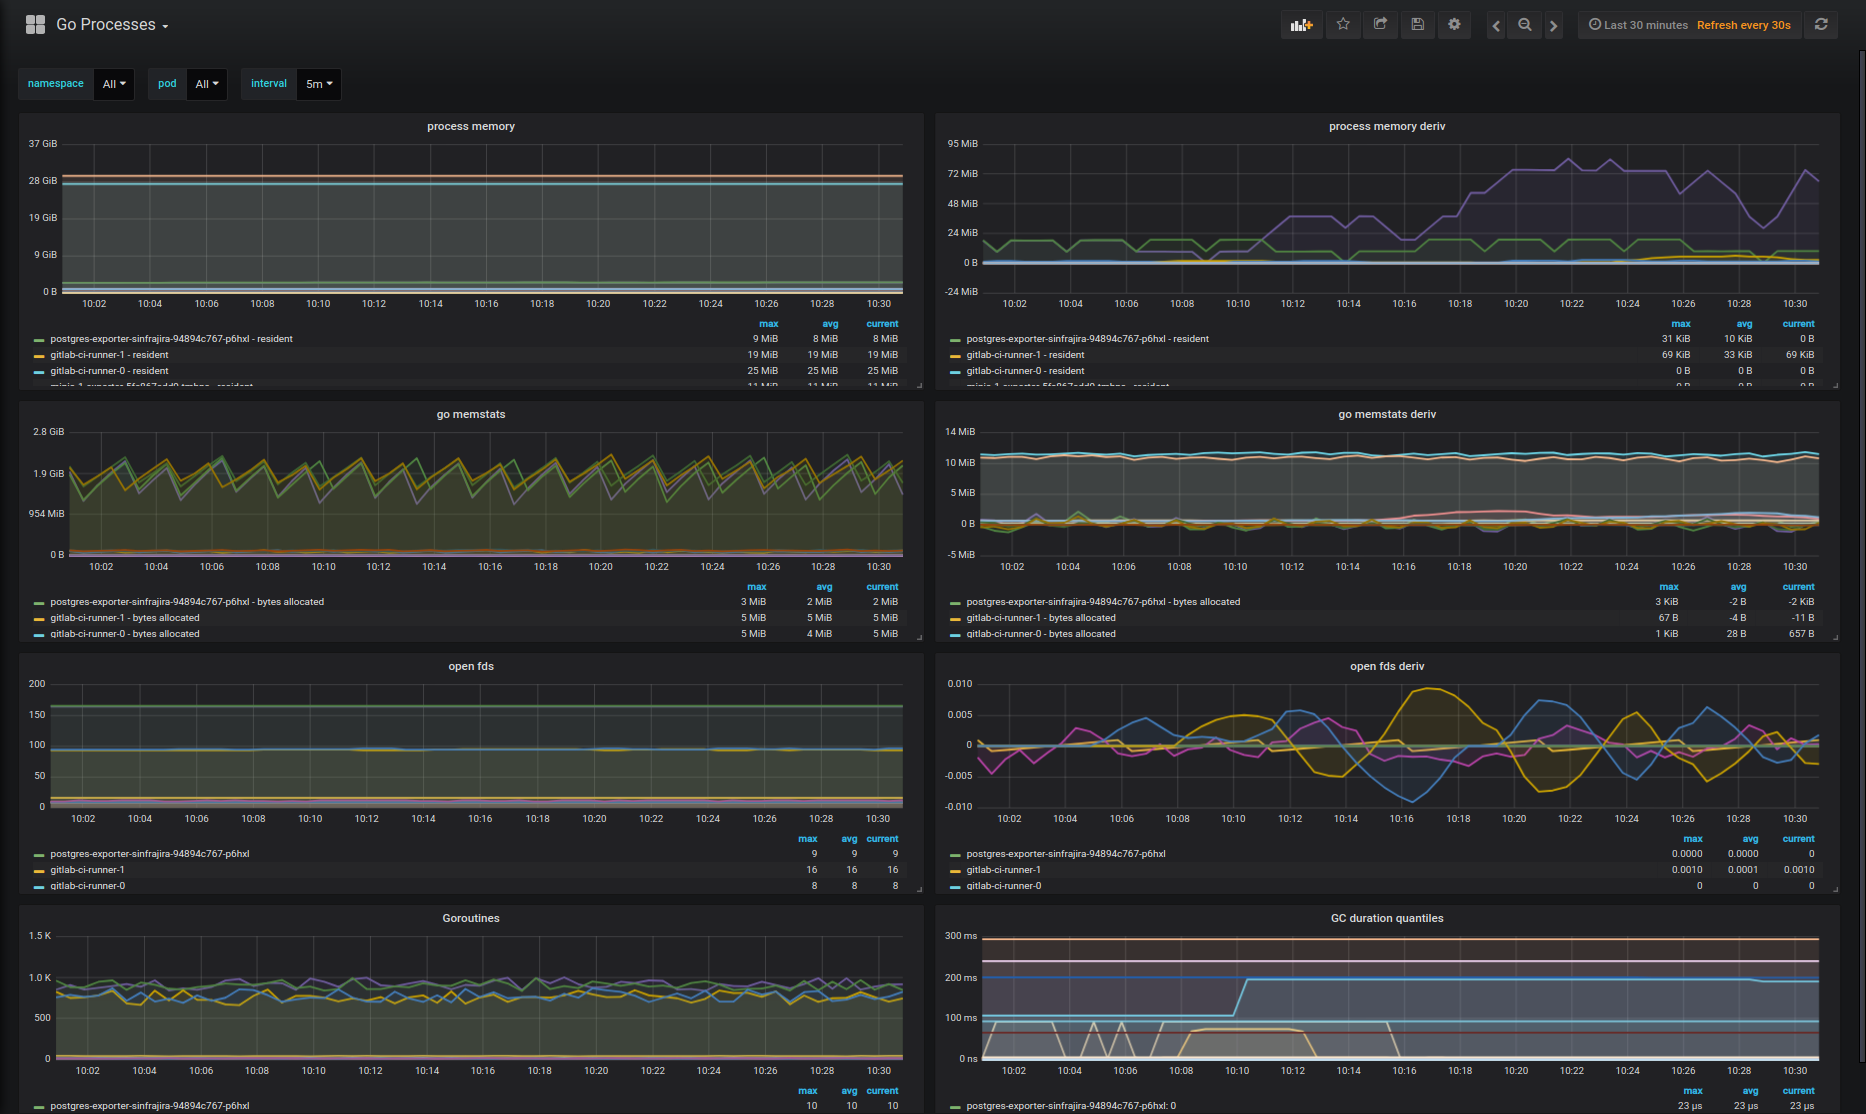
This dashboard monitors the health and resource usage of Go processes by visualizing memory, thread, and GC metrics. It highlights memory dynamics with process_resident_memory_bytes and go_memstats_alloc_bytes, tracks open file descriptors via process_open_fds, and surfaces concurrency and GC activity through go_goroutines and go_gc_duration_seconds with derivative panels to show rate changes over time.
Screenshots
Get Dashboard✕
Download
Copy to Clipboard