Harbor 9,0419,041
Description
Screenshots
Used Metrics 2828
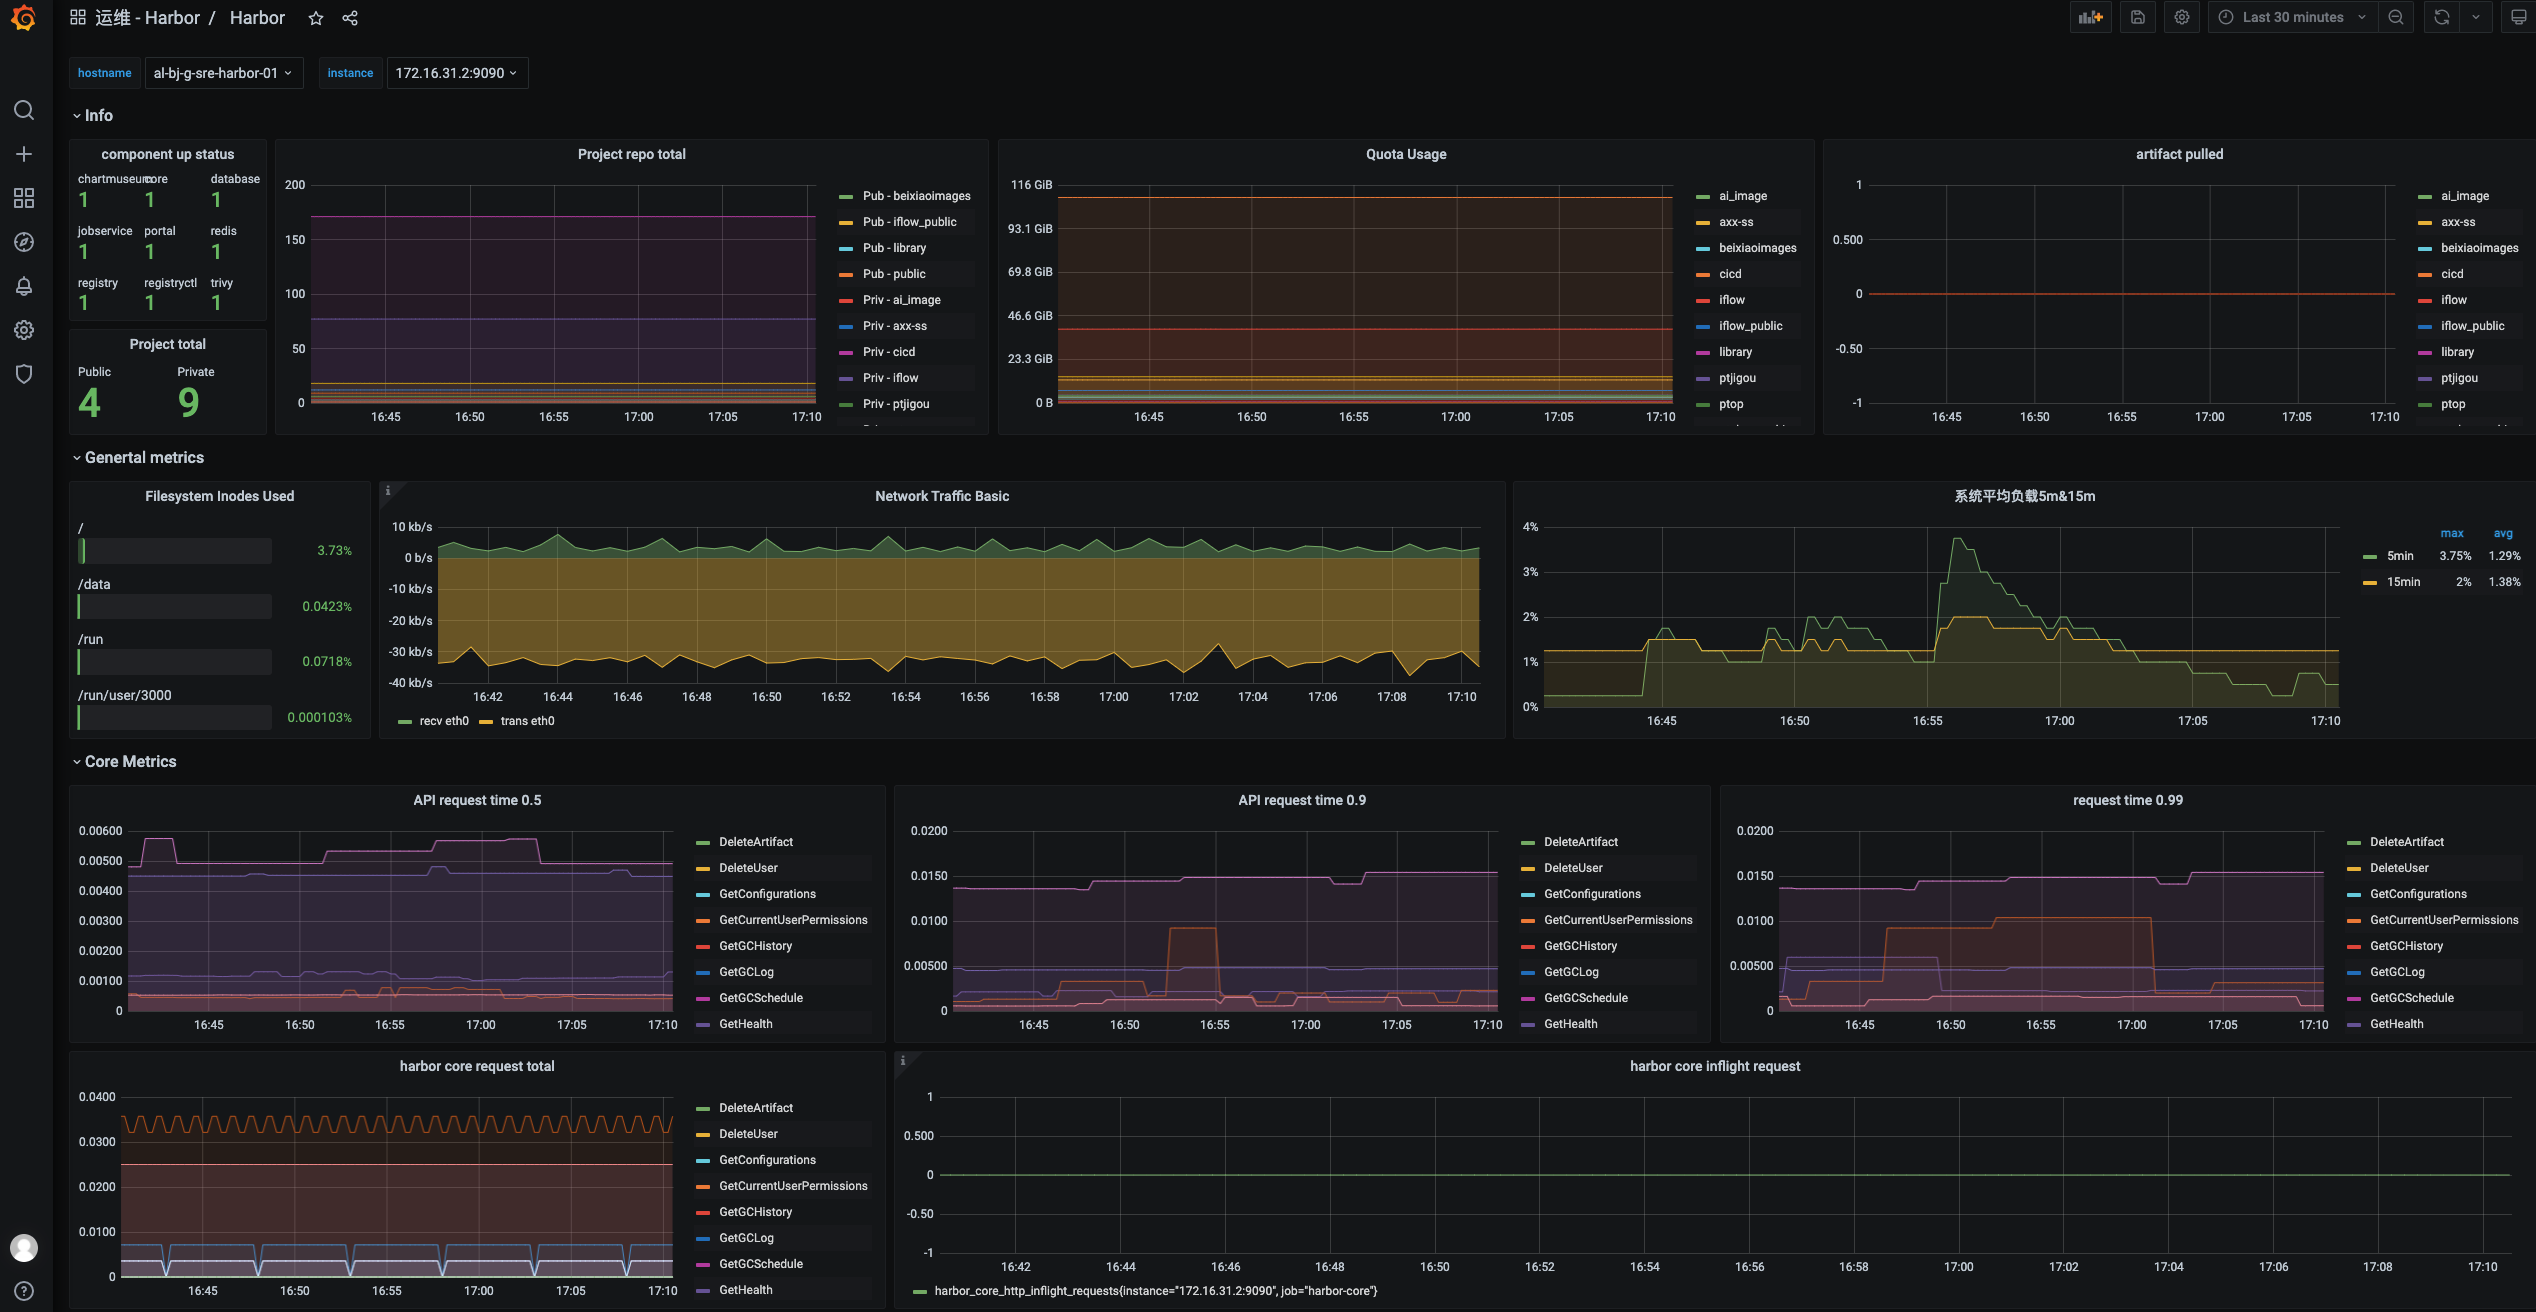
harbor_artifact_pulled
harbor_core_http_inflight_requests
harbor_core_http_request_duration_seconds
harbor_core_http_request_total
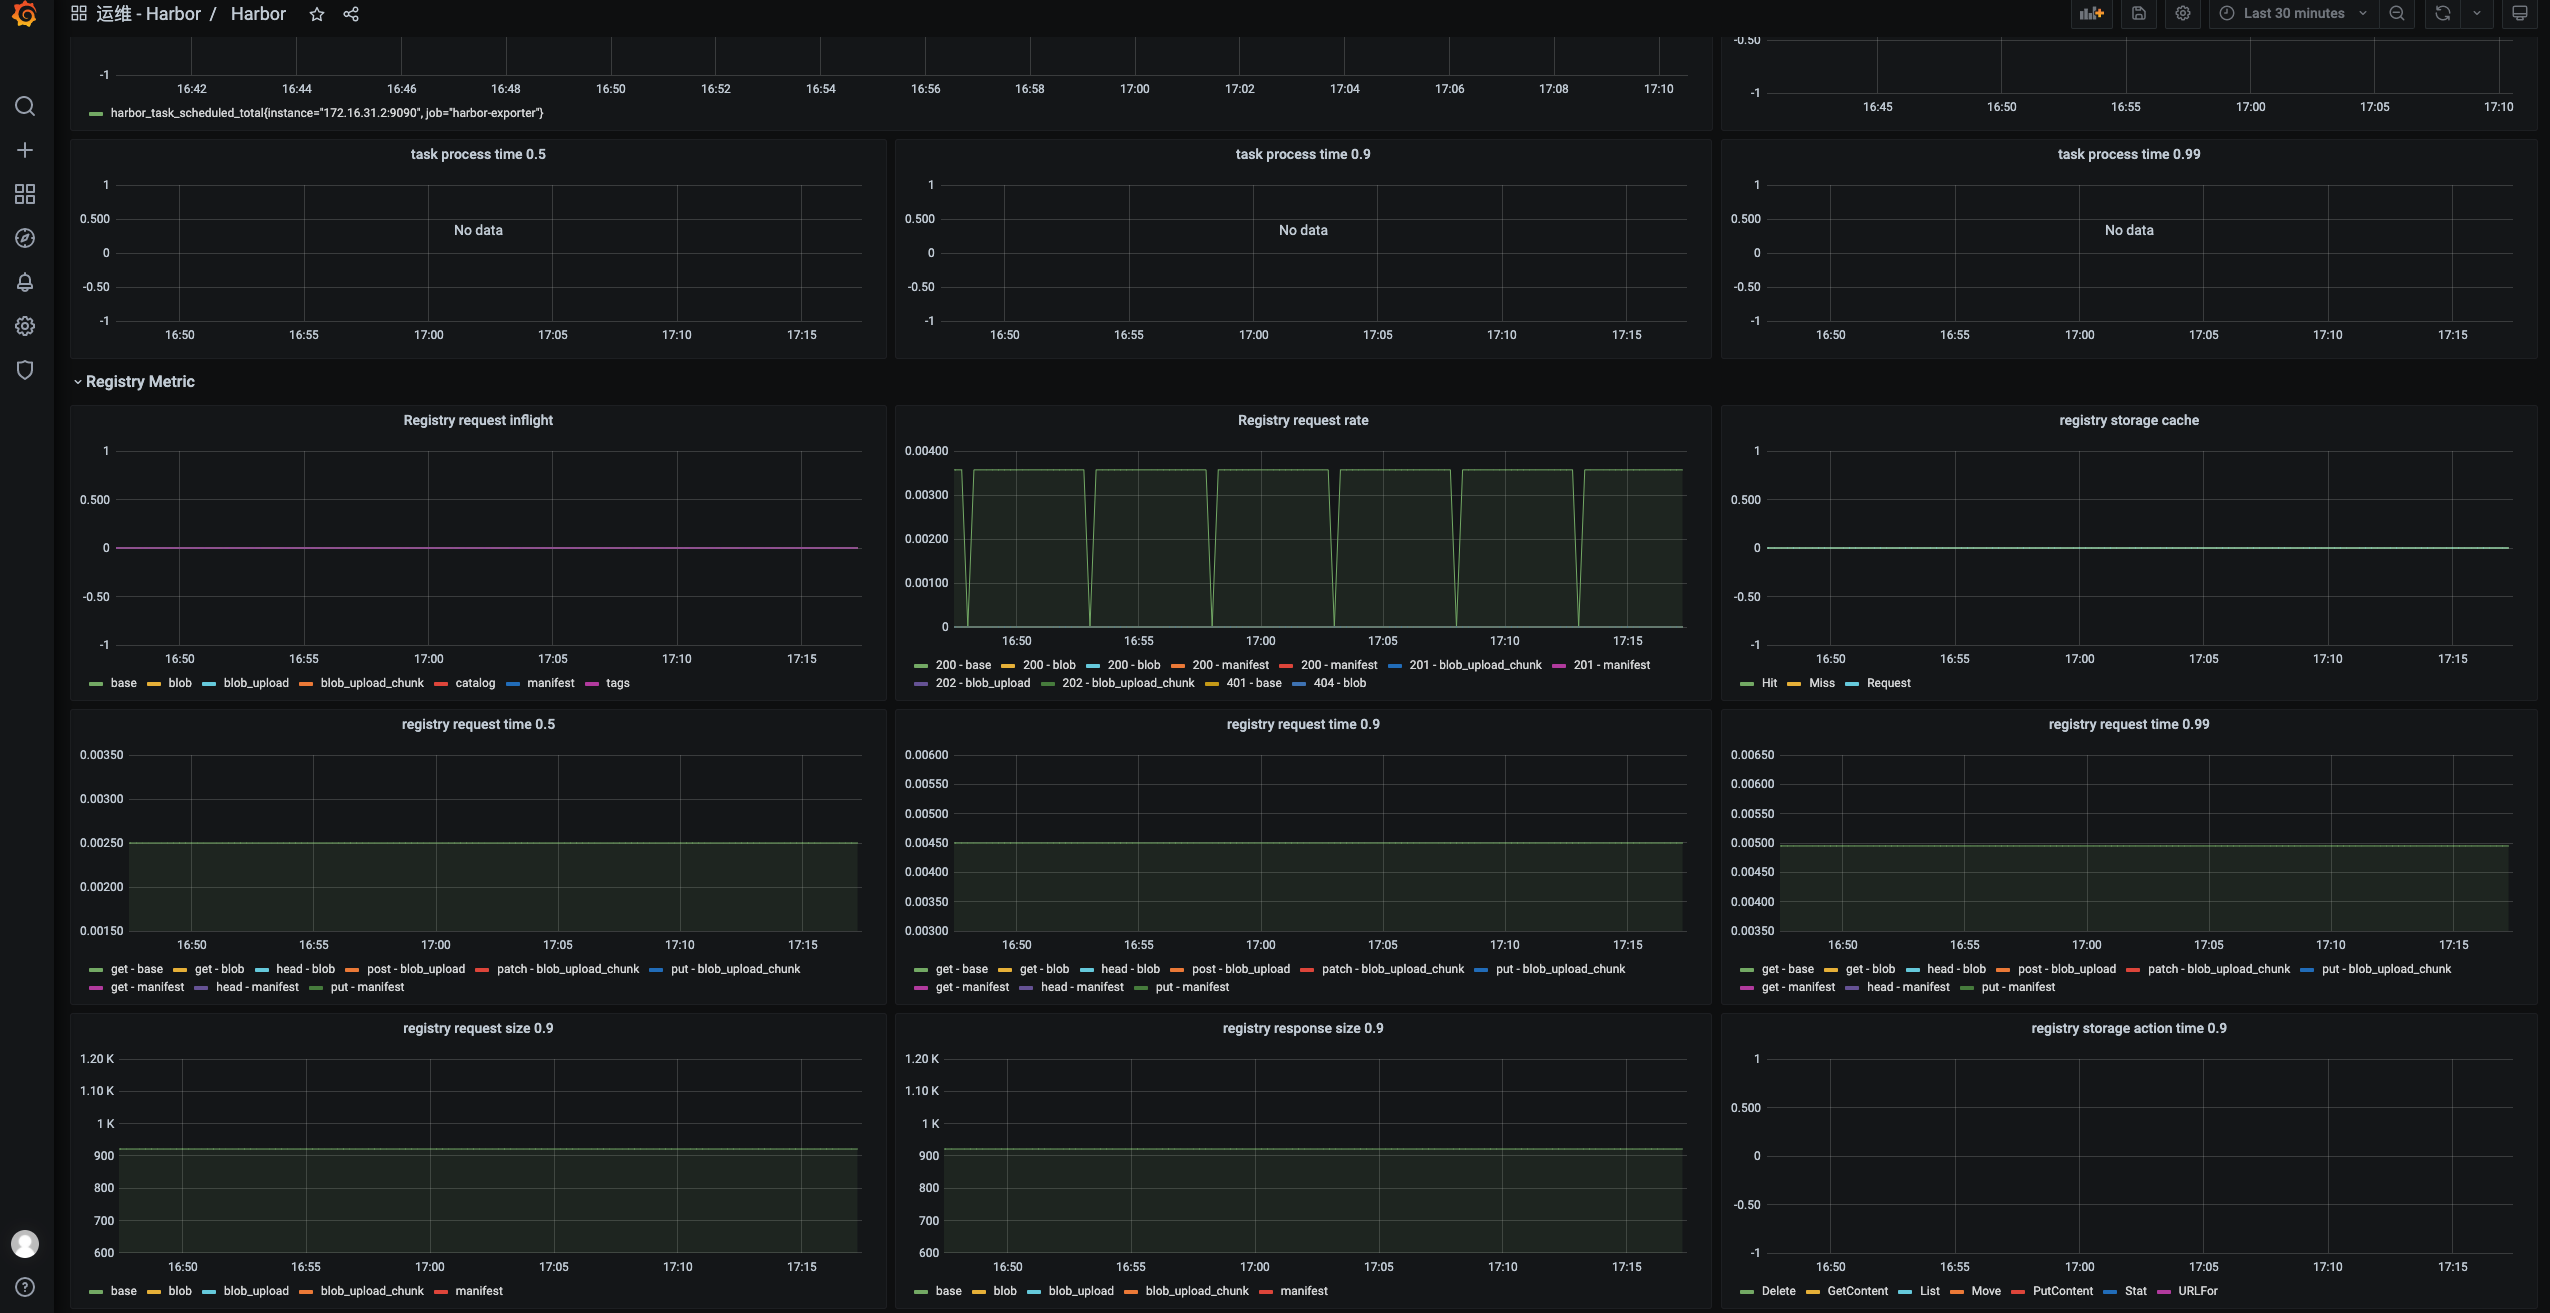
harbor_jobservice_task_process_time_seconds
harbor_jobservice_task_total
harbor_project_quota_usage_byte
harbor_project_repo_total
harbor_project_total
harbor_task_concurrency
harbor_task_queue_latency
harbor_task_queue_size
harbor_task_scheduled_total
harbor_up
-
node_cpu_seconds_total
-
node_filesystem_files
-
node_filesystem_files_free
-
node_load15
-
node_load5
-
node_network_receive_bytes_total
-
node_network_transmit_bytes_total
registry_http_in_flight_requests
registry_http_request_duration_seconds_bucket
registry_http_request_size_bytes_bucket
registry_http_requests_total
registry_http_response_size_bytes_bucket
registry_storage_action_seconds_bucket
registry_storage_cache_total