Hashicorp Vault 2,877,3942,877,394 4.0 (2 reviews)
Description
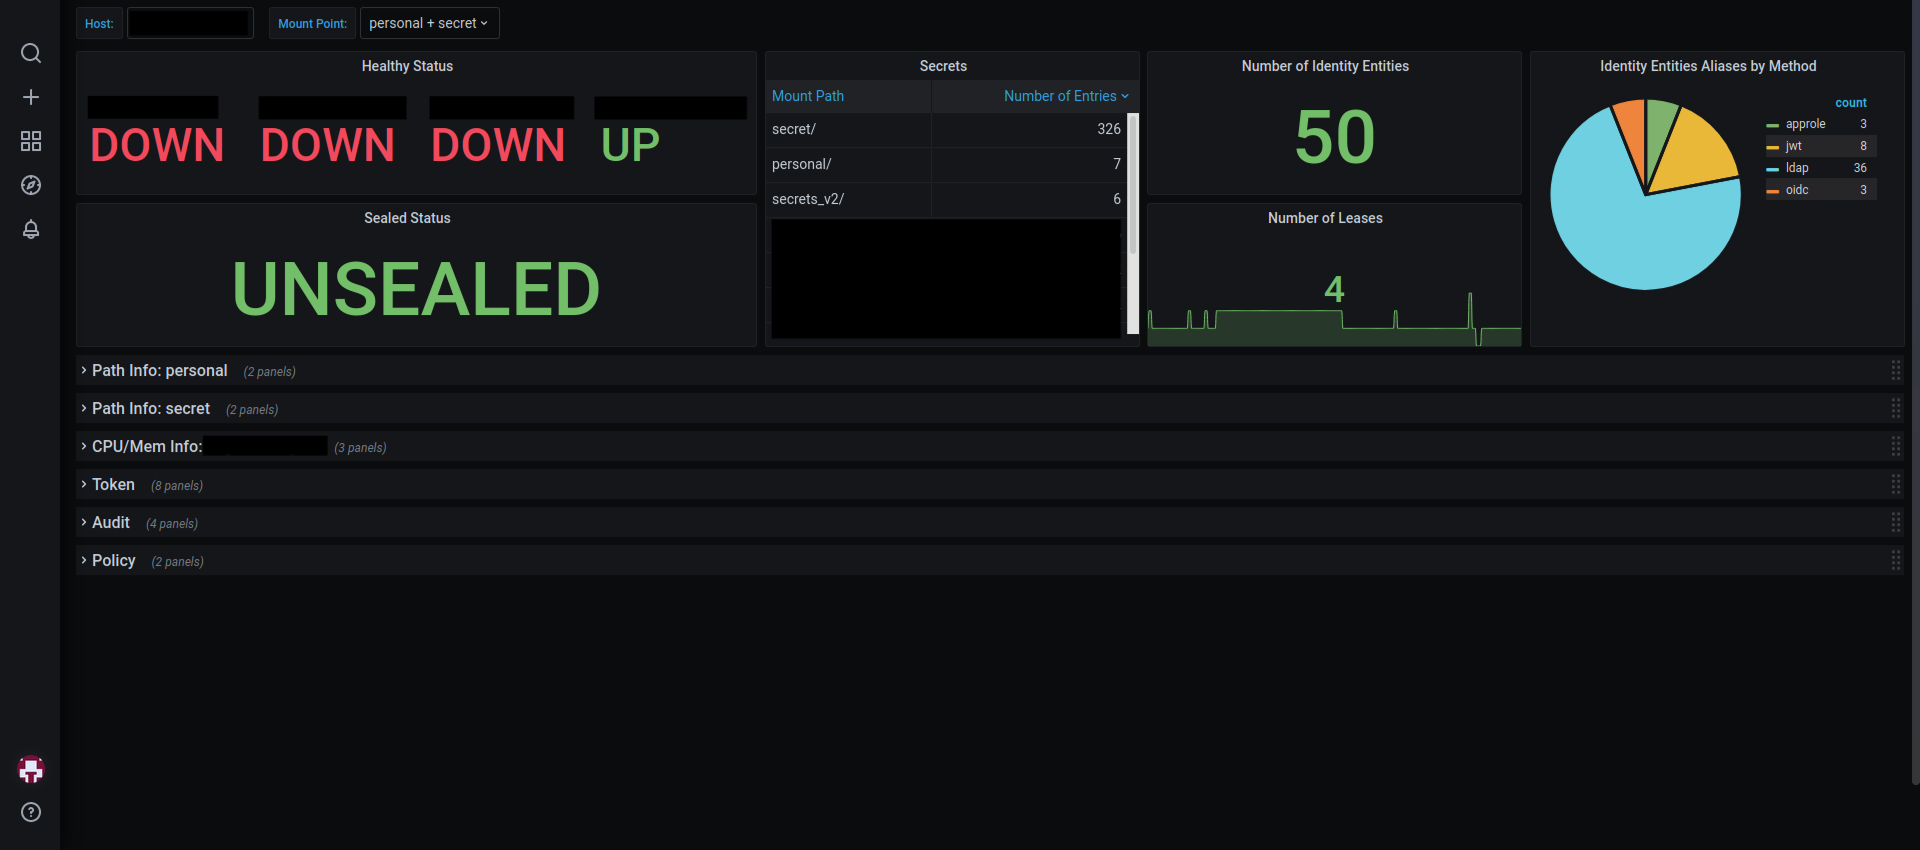
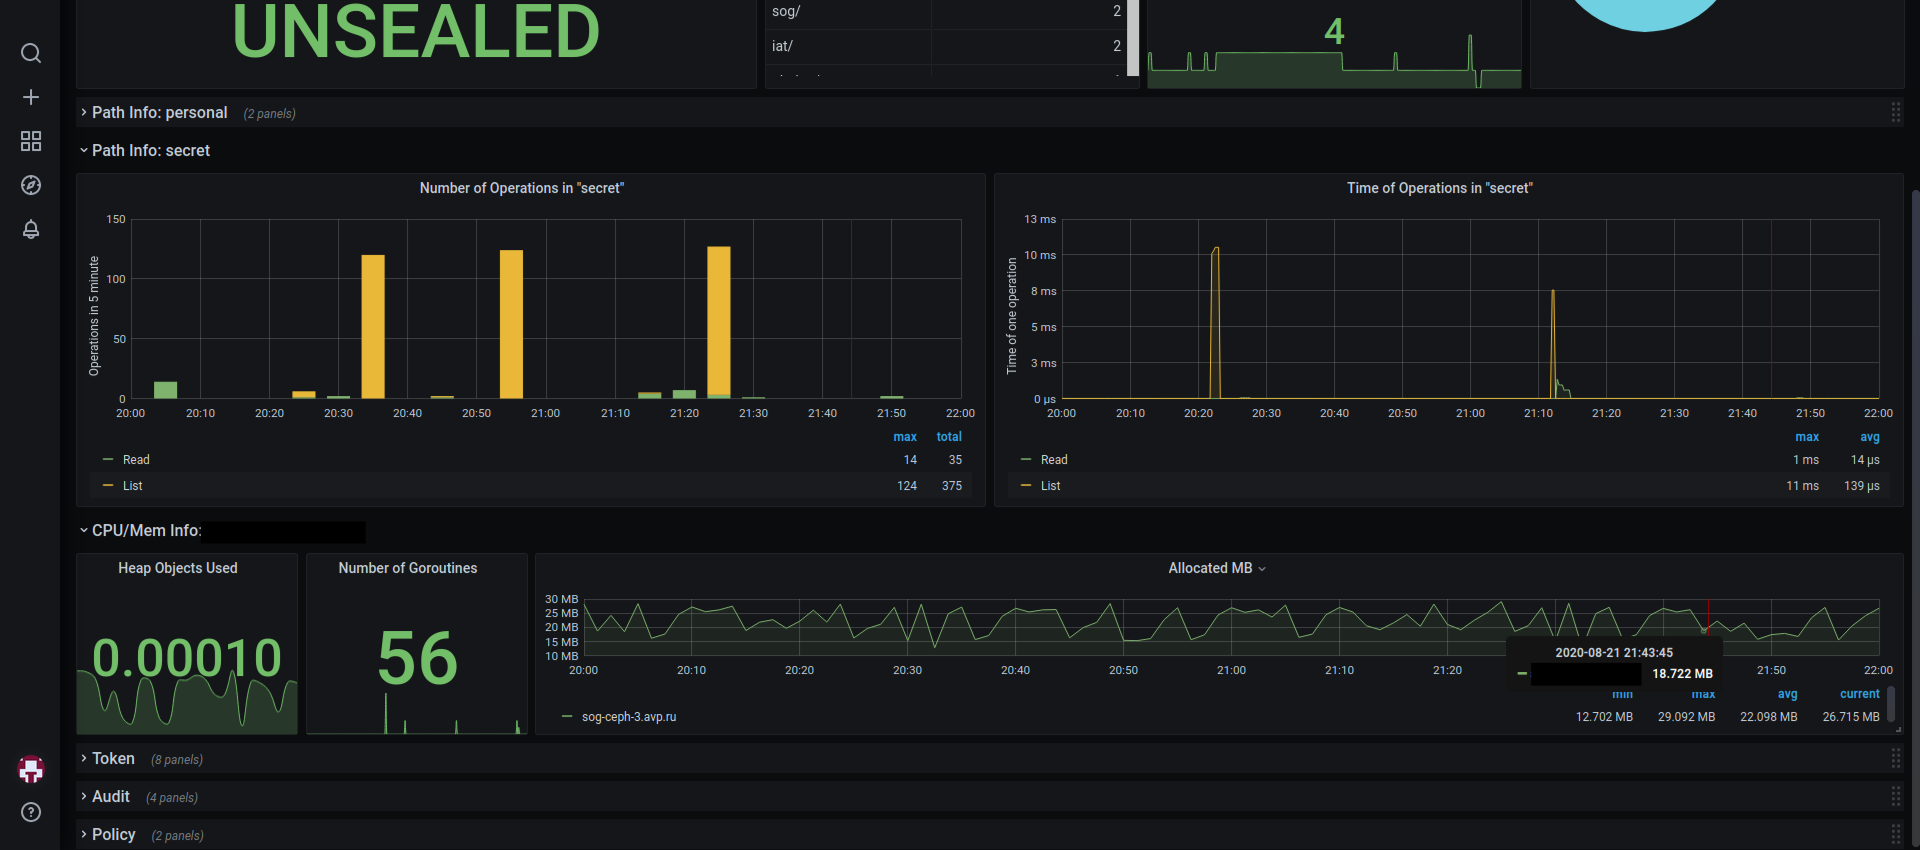
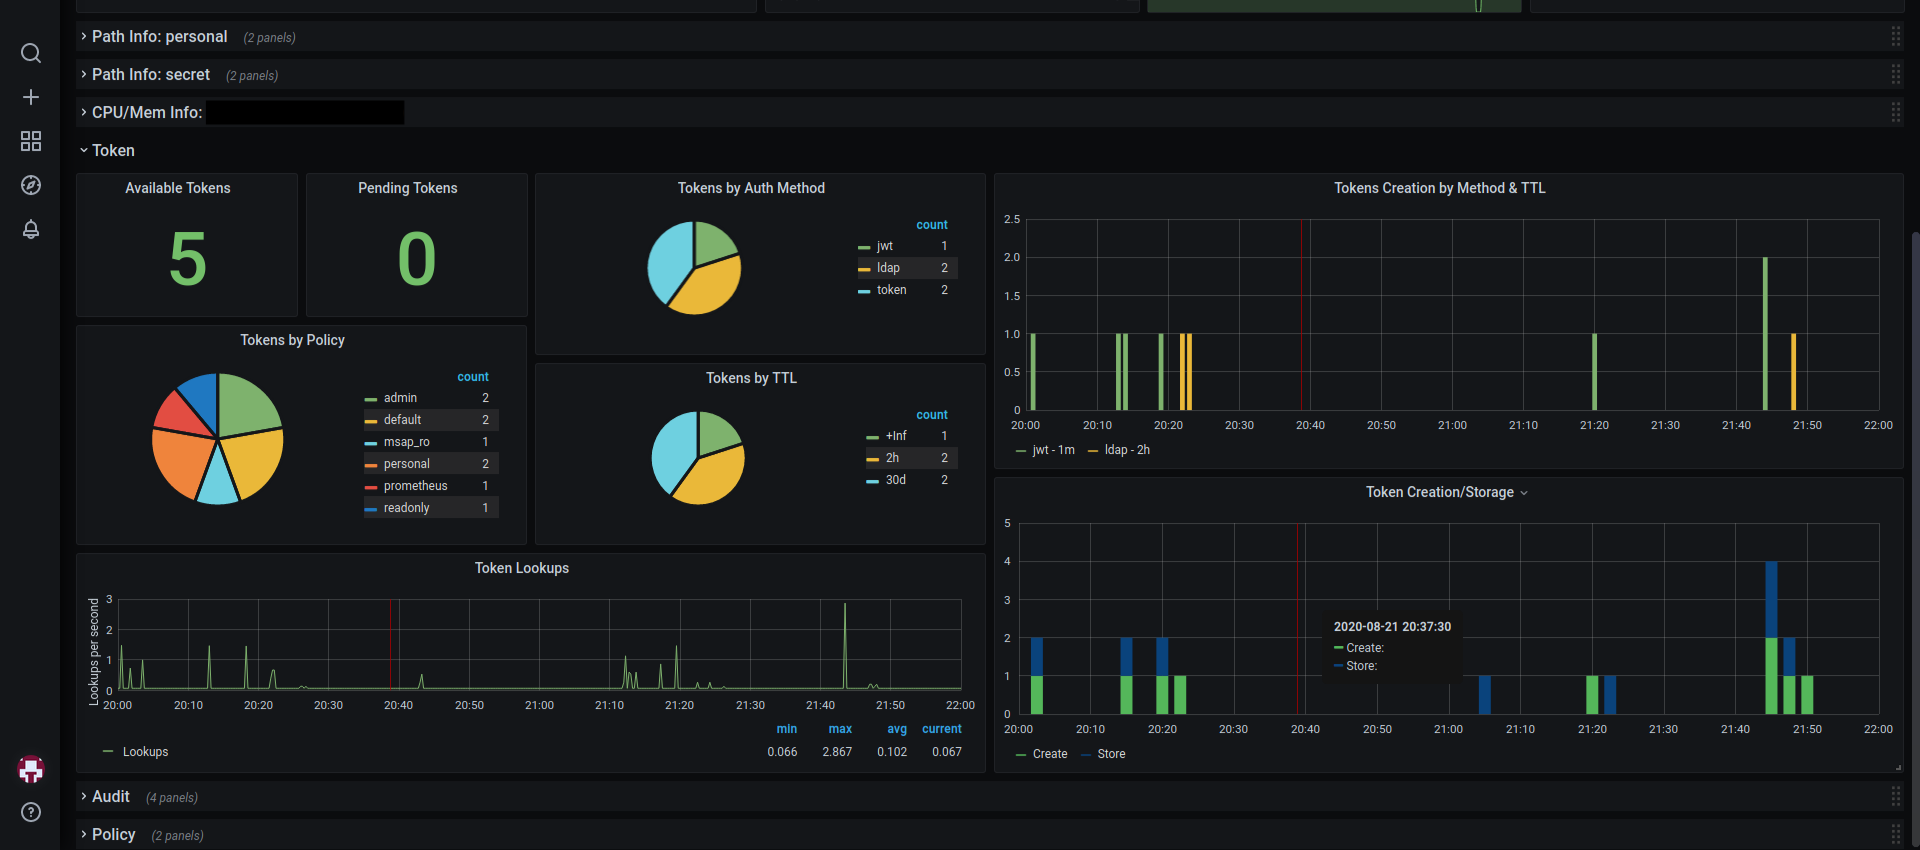
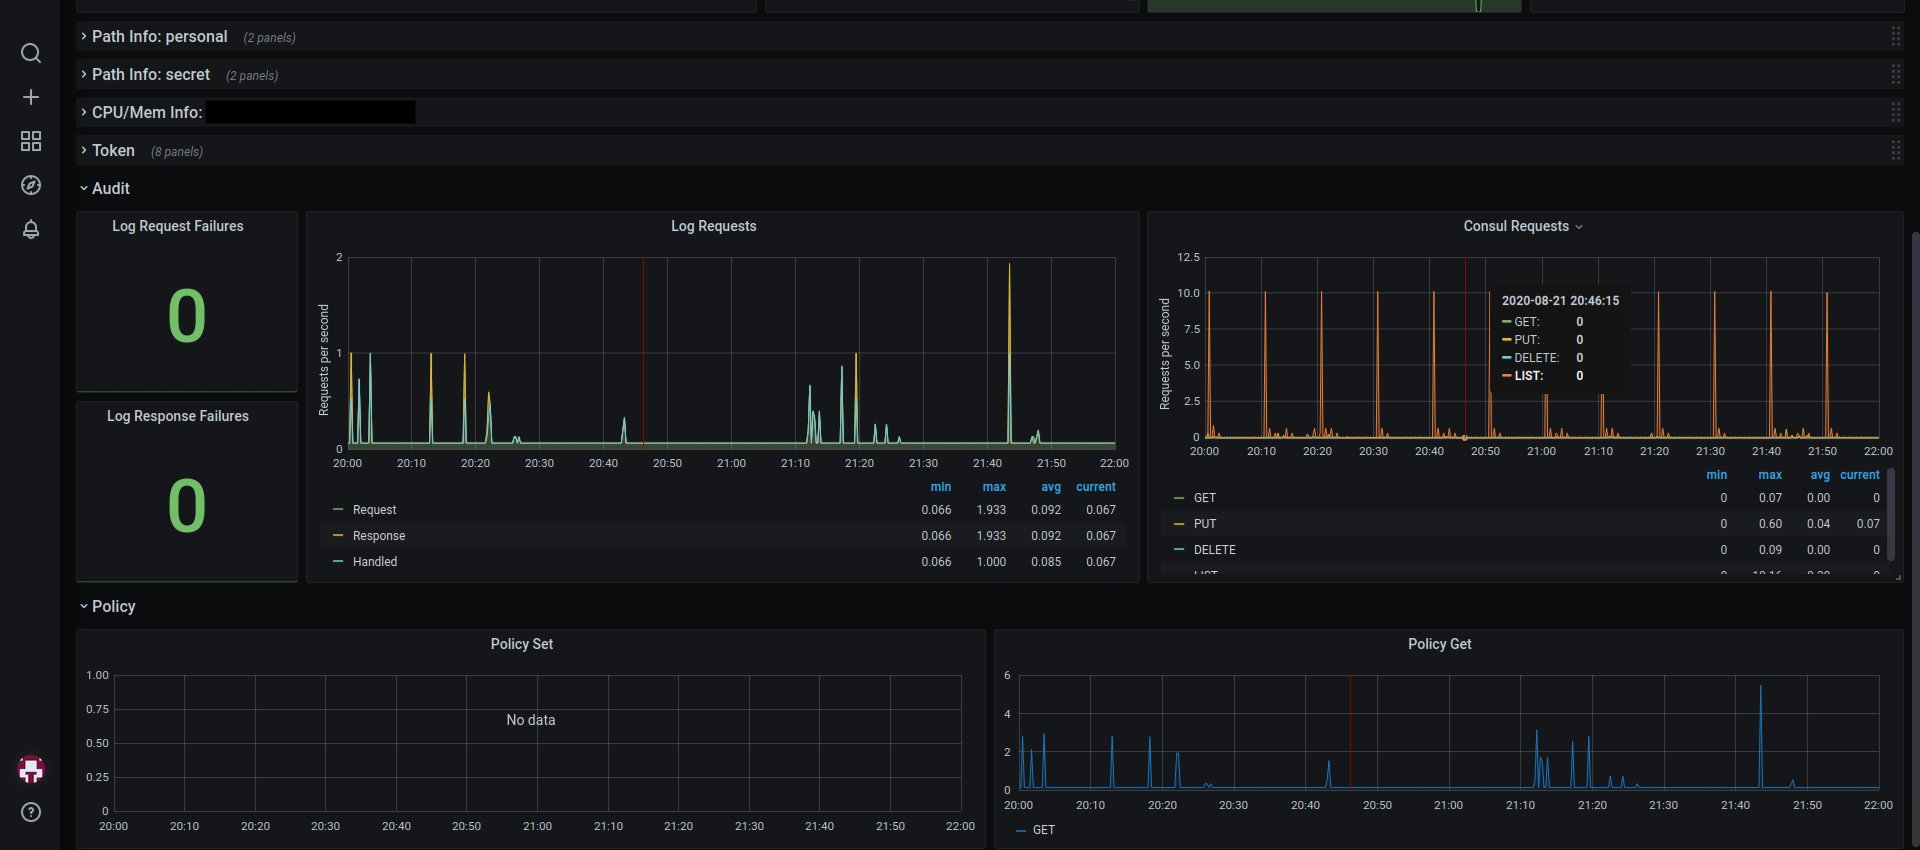
This dashboard provides a consolidated view of Vault health and activity by polling core metrics such as up, vault_core_unsealed, and vault_runtime_alloc_bytes to indicate service availability, unsealed status, and memory usage. It includes panels for identity and secret management (e.g., vault_identity_num_entities, vault_secret_kv_count, vault_identity_entity_alias_count) and operational telemetry like token lifecycle (e.g., vault_expire_num_leases, Tokens by TTL), request/log analytics, and runtime performance indicators (e.g., vault_runtime_num_goroutines, vault_runtime_malloc_count).**
Screenshots
Used Metrics 2929
-
up
vault_audit_log_request_count
vault_audit_log_request_failure
vault_audit_log_response_count
vault_audit_log_response_failure
vault_consul_delete_count
vault_consul_get_count
vault_consul_list_count
vault_consul_put_count
vault_core_handle_request_count
vault_core_unsealed
vault_expire_num_leases
vault_identity_entity_alias_count
vault_identity_num_entities
vault_policy_get_policy_count
vault_policy_set_policy_count
vault_runtime_alloc_bytes
vault_runtime_heap_objects
vault_runtime_malloc_count
vault_runtime_num_goroutines
vault_secret_kv_count
vault_token_count
vault_token_count_by_auth
vault_token_count_by_policy
vault_token_count_by_ttl
vault_token_create_count
vault_token_creation
vault_token_lookup_count
vault_token_store_count