Istio Control Plane Dashboard 63,451,77463,451,774 5.0 (6 reviews)
Description
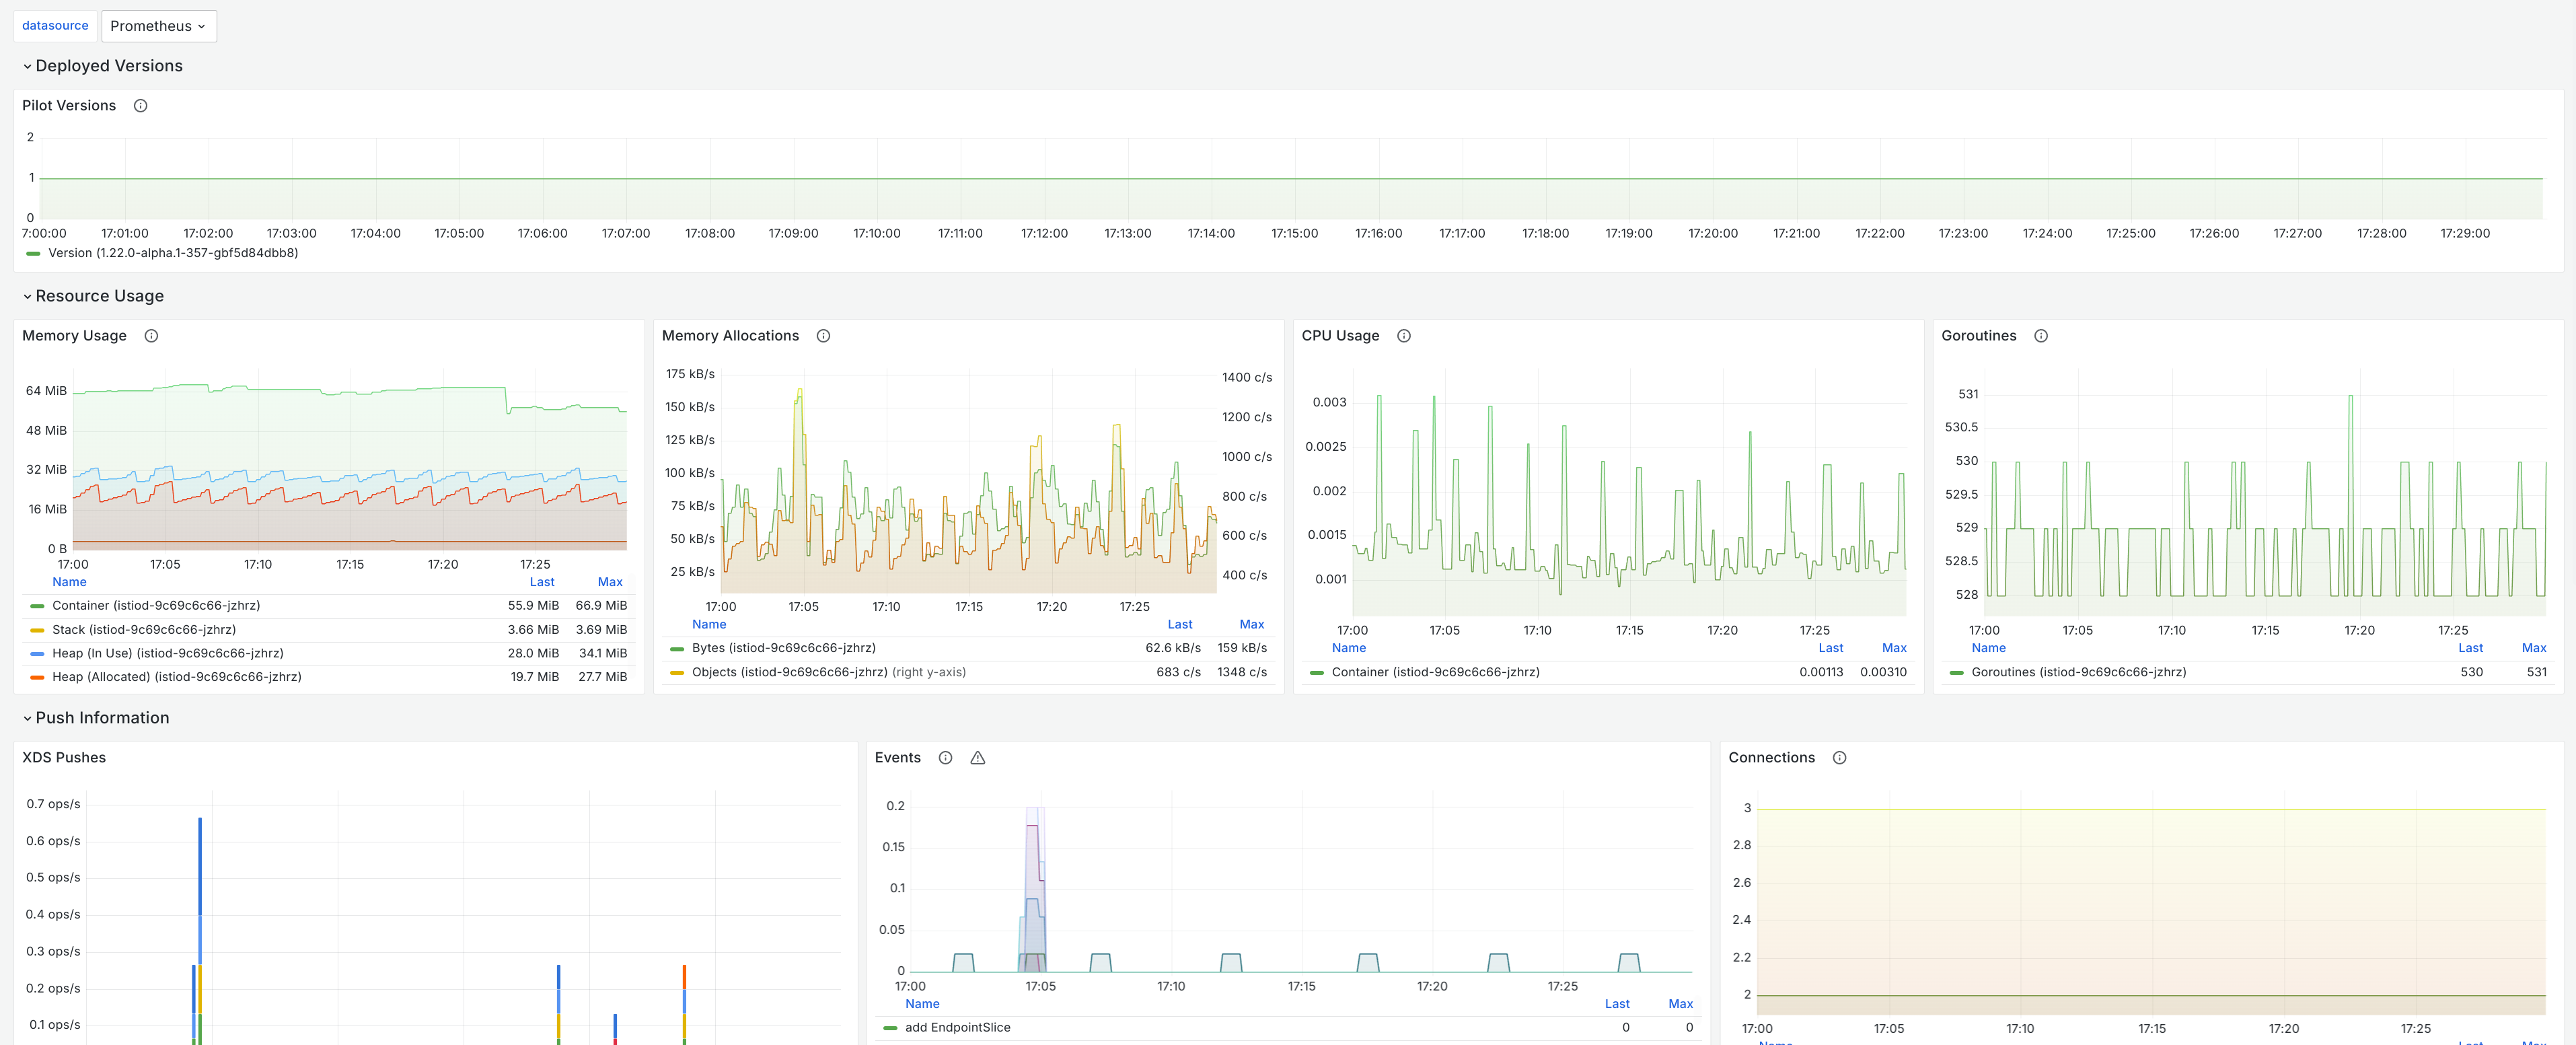
This Grafana dashboard monitors the Istio control plane (Pilot) health and performance, combining resource, runtime, and control-plane telemetry into a single view for operational troubleshooting. Key panels show container and process resource usage (memory via container_memory_working_set_bytes and go_memstats_*, CPU via container_cpu_usage_seconds_total), runtime metrics (go_goroutines, heap/stack/alloc/mallocs), and control-plane activity such as pilot_xds_pushes, connections, events, push errors/time/size, validation, and injection. Together these metrics help you detect memory leaks, goroutine or CPU spikes, XDS delivery issues, and config validation/injection failures quickly.
Screenshots
Used Metrics 2323
-
container_cpu_usage_seconds_total
-
container_memory_working_set_bytes
envoy_cluster_upstream_cx_active
galley_validation_failed
galley_validation_passed
-
go_goroutines
-
go_memstats_alloc_bytes_total
-
go_memstats_heap_alloc_bytes
-
go_memstats_heap_inuse_bytes
-
go_memstats_mallocs_total
-
go_memstats_stack_inuse_bytes
istio_build
pilot_k_cfg_events
pilot_k_reg_events
pilot_push_triggers
pilot_total_xds_internal_errors
pilot_total_xds_rejects
pilot_xds
pilot_xds_config_size_bytes_bucket
pilot_xds_push_time_bucket
pilot_xds_pushes
sidecar_injection_failure_total
sidecar_injection_success_total