Istio Ztunnel Dashboard 424,498424,498
Description
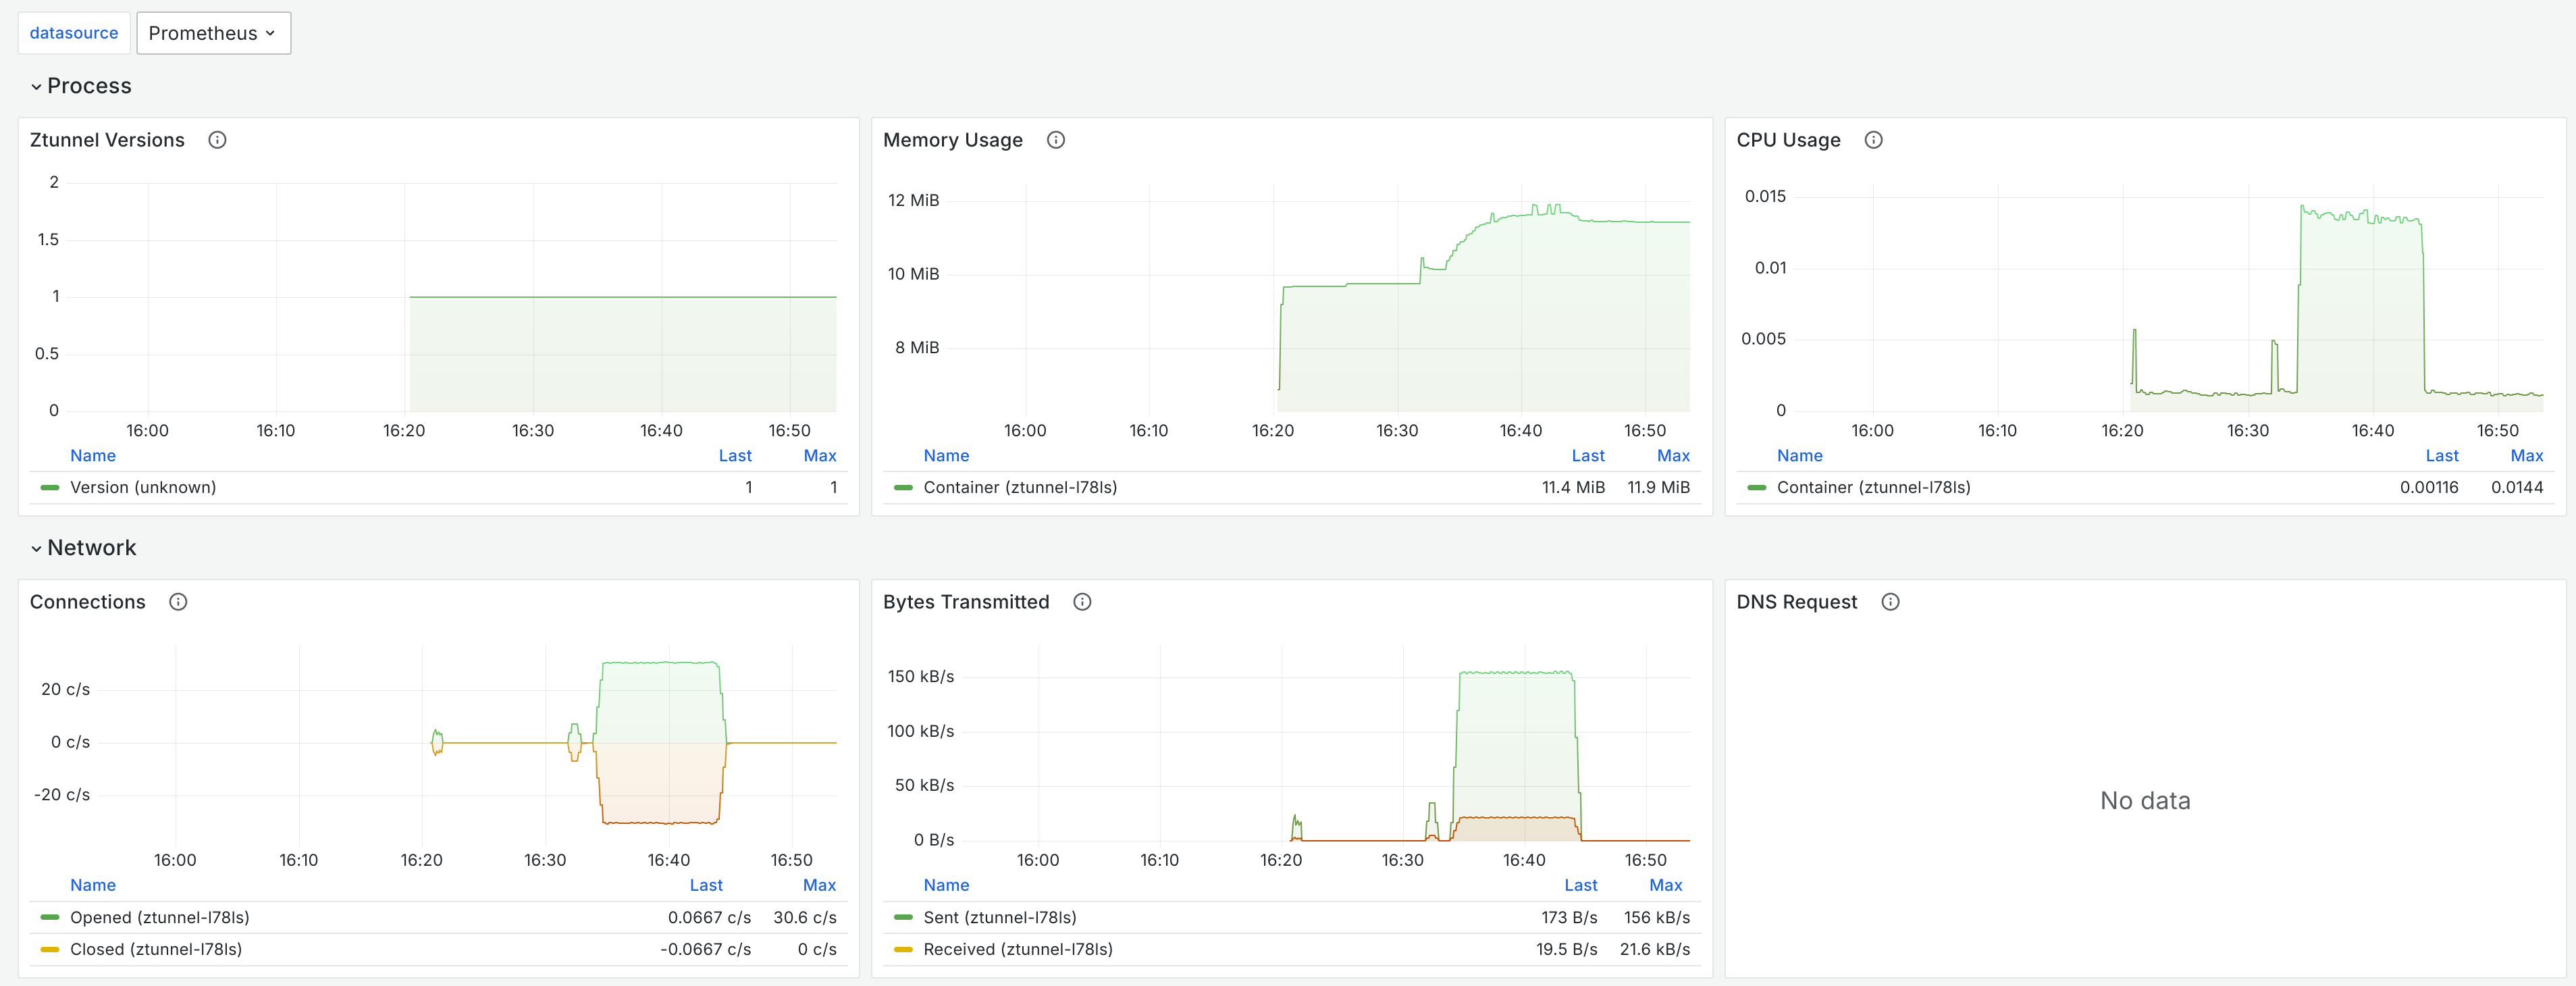
Monitors Istio’s ztunnel resource usage and connectivity, with a focus on performance, throughput, and lifecycle events. Key features include real-time resource metrics such as container_memory_working_set_bytes and container_cpu_usage_seconds_total, as well as network and XDS activity evidenced by istio_tcp_connections_opened_total, istio_tcp_sent_bytes_total, and istio_xds_message_total to track connection dynamics and configuration updates.
Screenshots
Used Metrics 1212
-
container_cpu_usage_seconds_total
-
container_memory_working_set_bytes
istio_build
istio_dns_requests_total
istio_tcp_connections_closed_total
istio_tcp_connections_opened_total
istio_tcp_received_bytes_total
istio_tcp_sent_bytes_total
istio_xds_connection_terminations_total
istio_xds_message_total
workload_manager_active_proxy_count
workload_manager_pending_proxy_count