JVM metrics 3,7903,790
5/4/2021
12/26/2021
2
>=7.5.5
Prometheus
Description
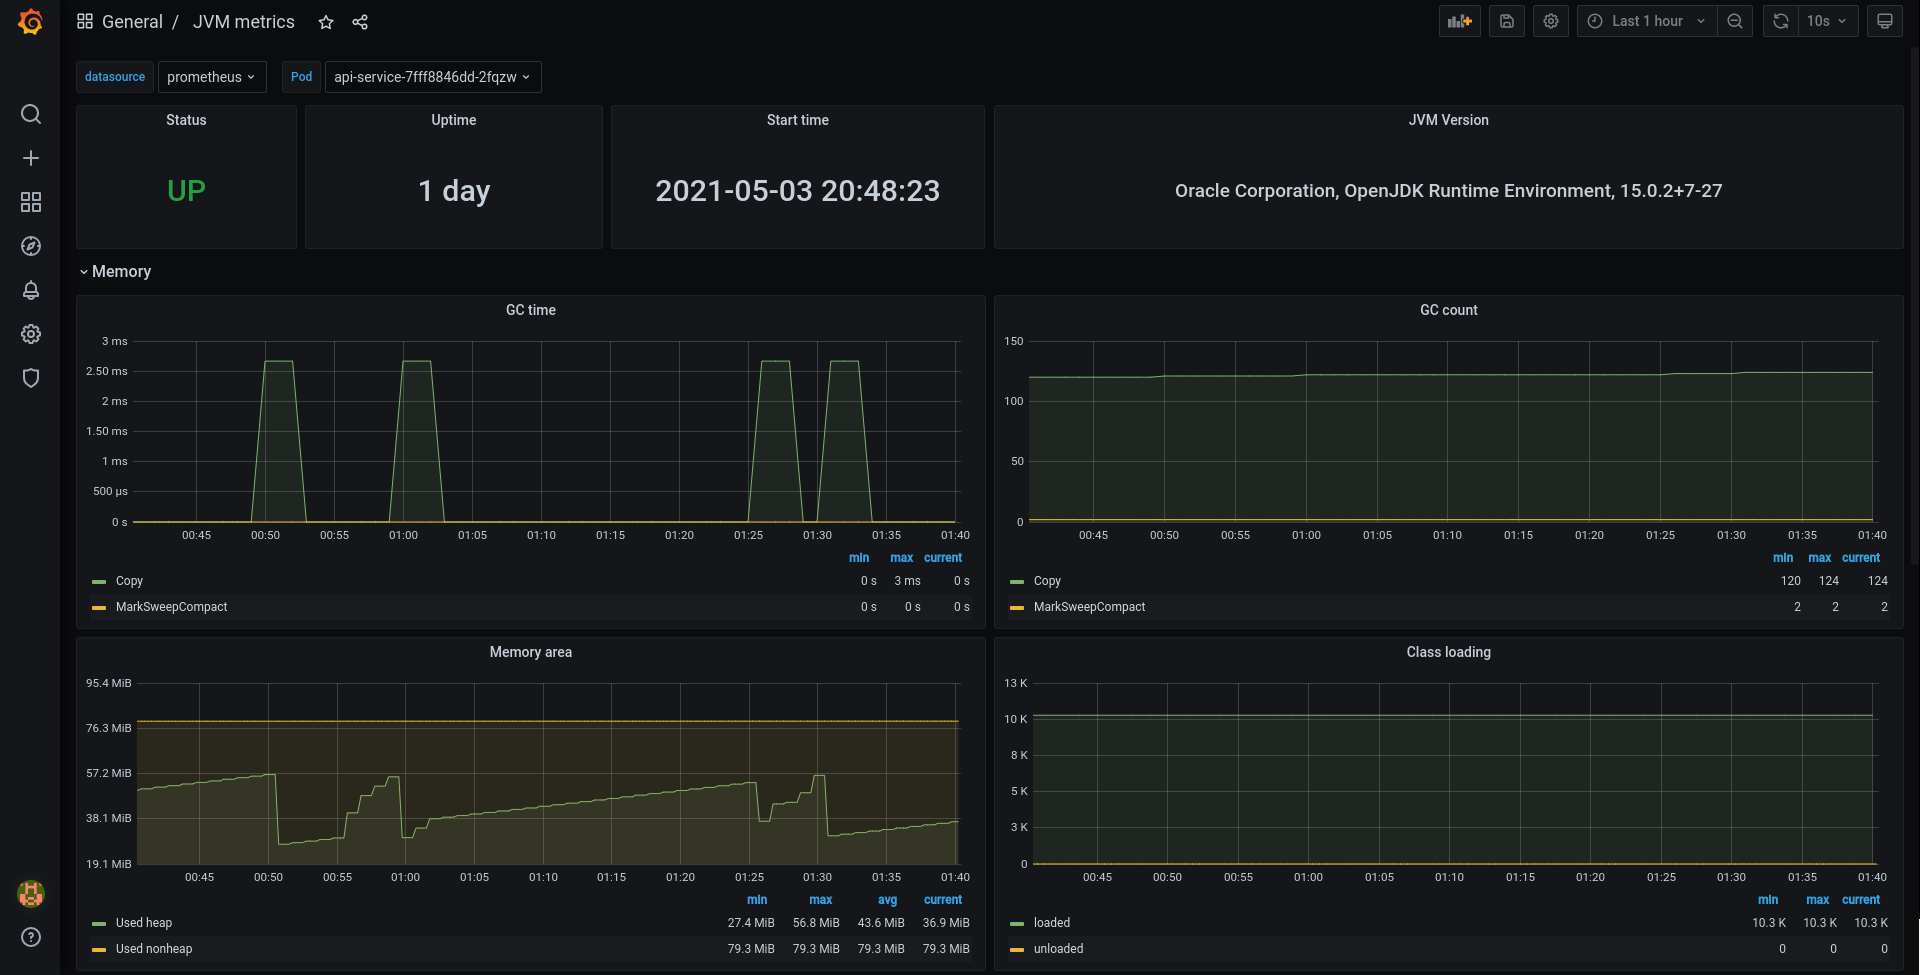
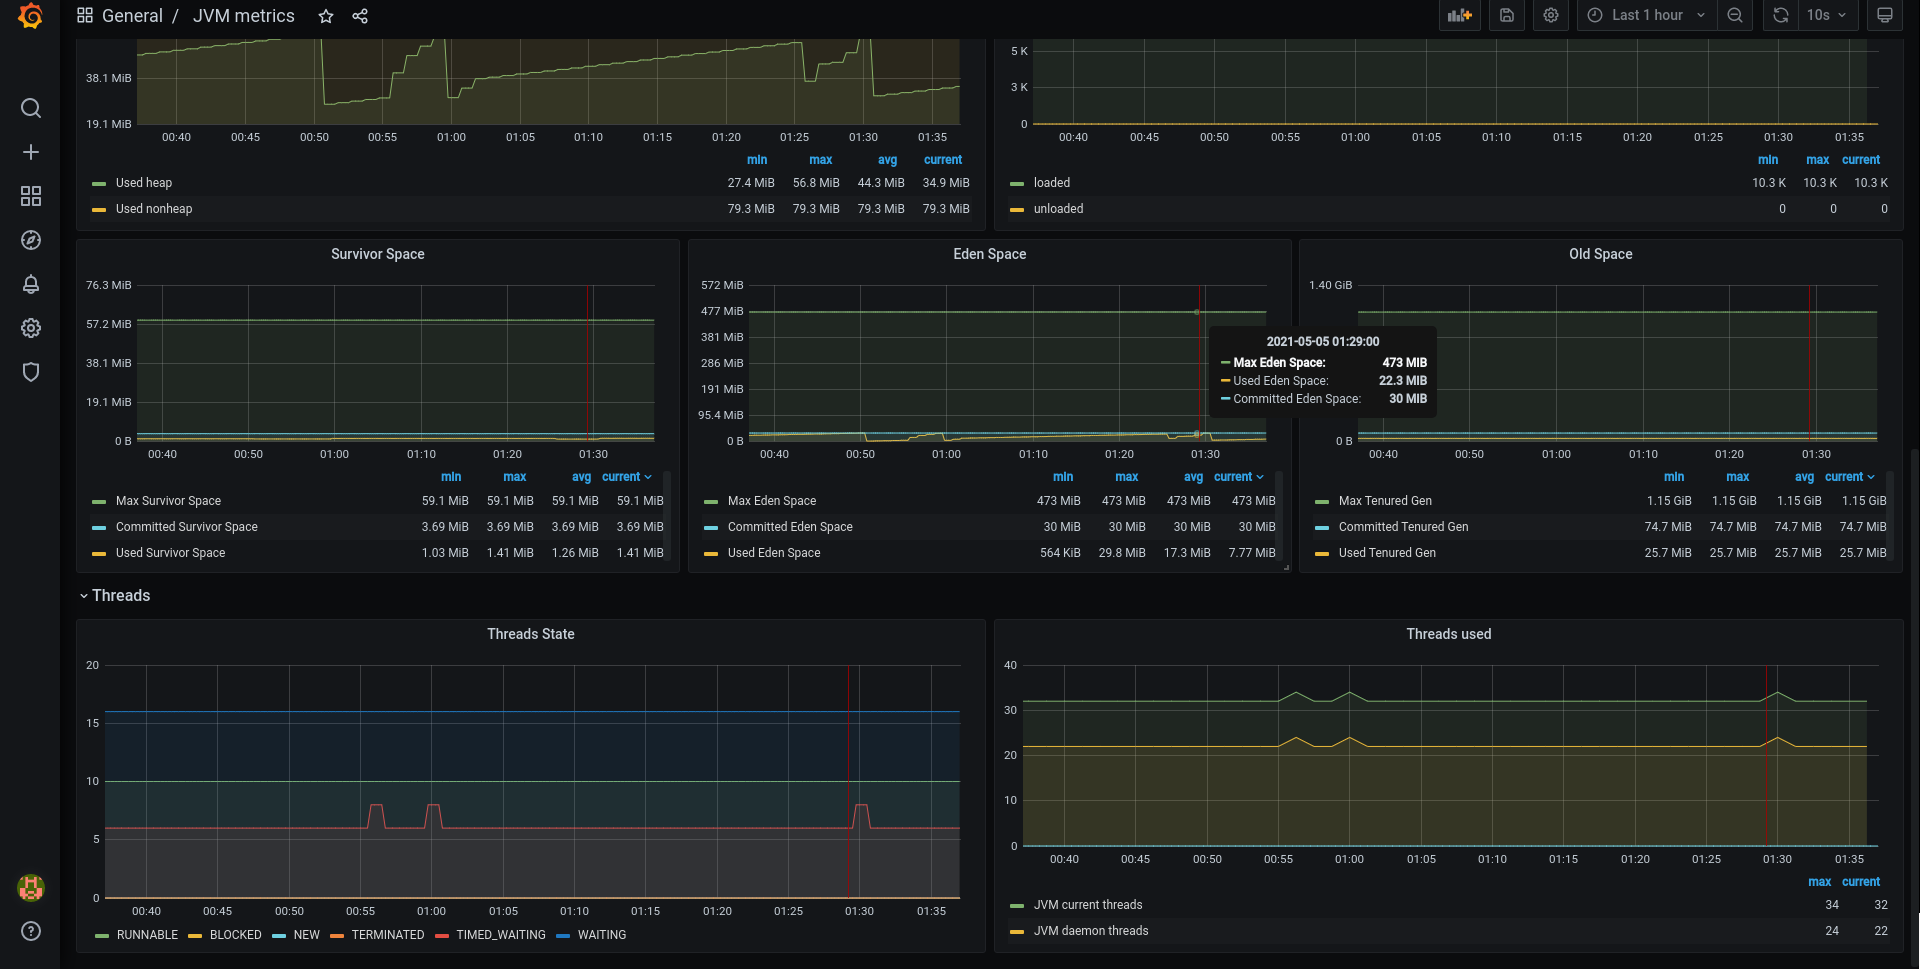
Dashboard for JVM metrics within Kubernetes, where Prometheus installed using community helm chart
Screenshots
Used Metrics 1919
jdk
jvm_classes_loaded
jvm_classes_unloaded_total
jvm_gc_collection_seconds_count
jvm_gc_collection_seconds_sum
jvm_info
jvm_memory_bytes_used
jvm_memory_pool_bytes_committed
jvm_memory_pool_bytes_max
jvm_memory_pool_bytes_used
jvm_threads_current
jvm_threads_daemon
jvm_threads_deadlocked
jvm_threads_state
-
process_start_time_seconds
runtime
-
up
vendor
version
Get Dashboard✕
Download
Copy to Clipboard