K3S cluster monitoring 79,66479,664 5.0 (1 reviews)
11/20/2021
11/20/2021
1
>=8.2.5
Prometheus
Description
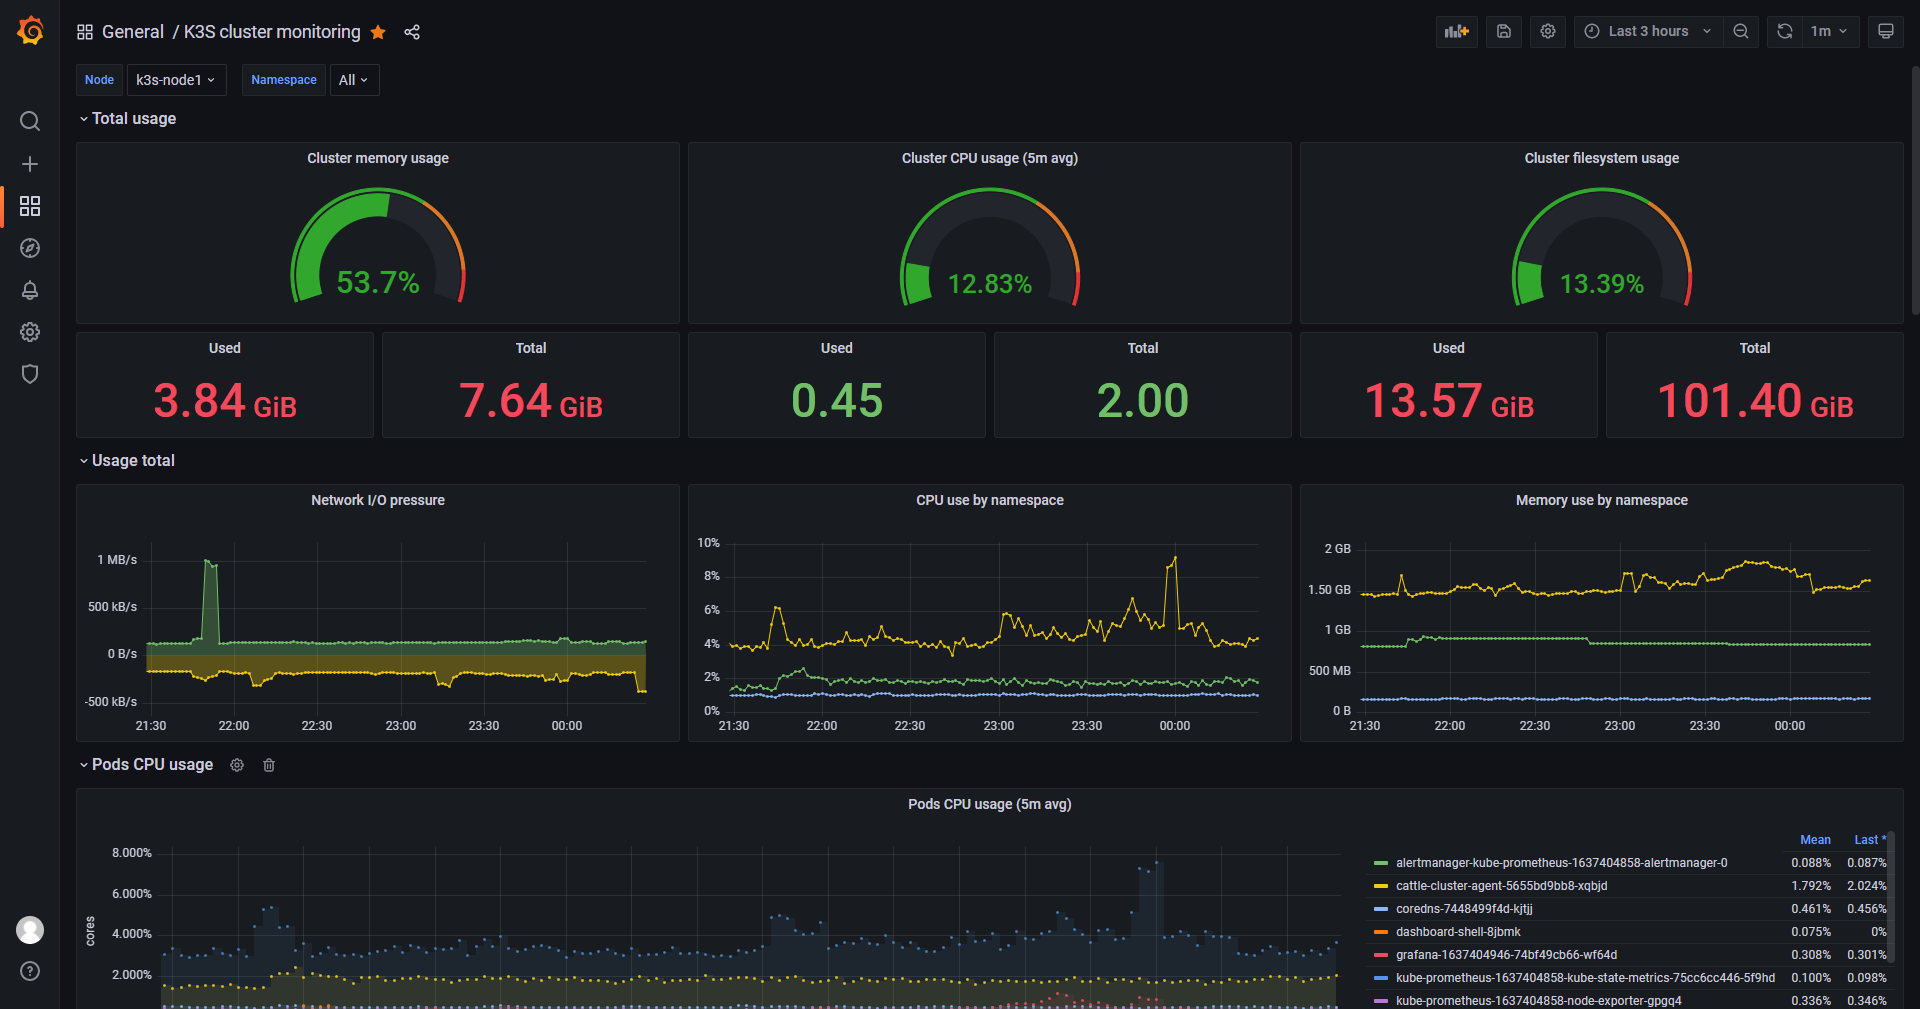
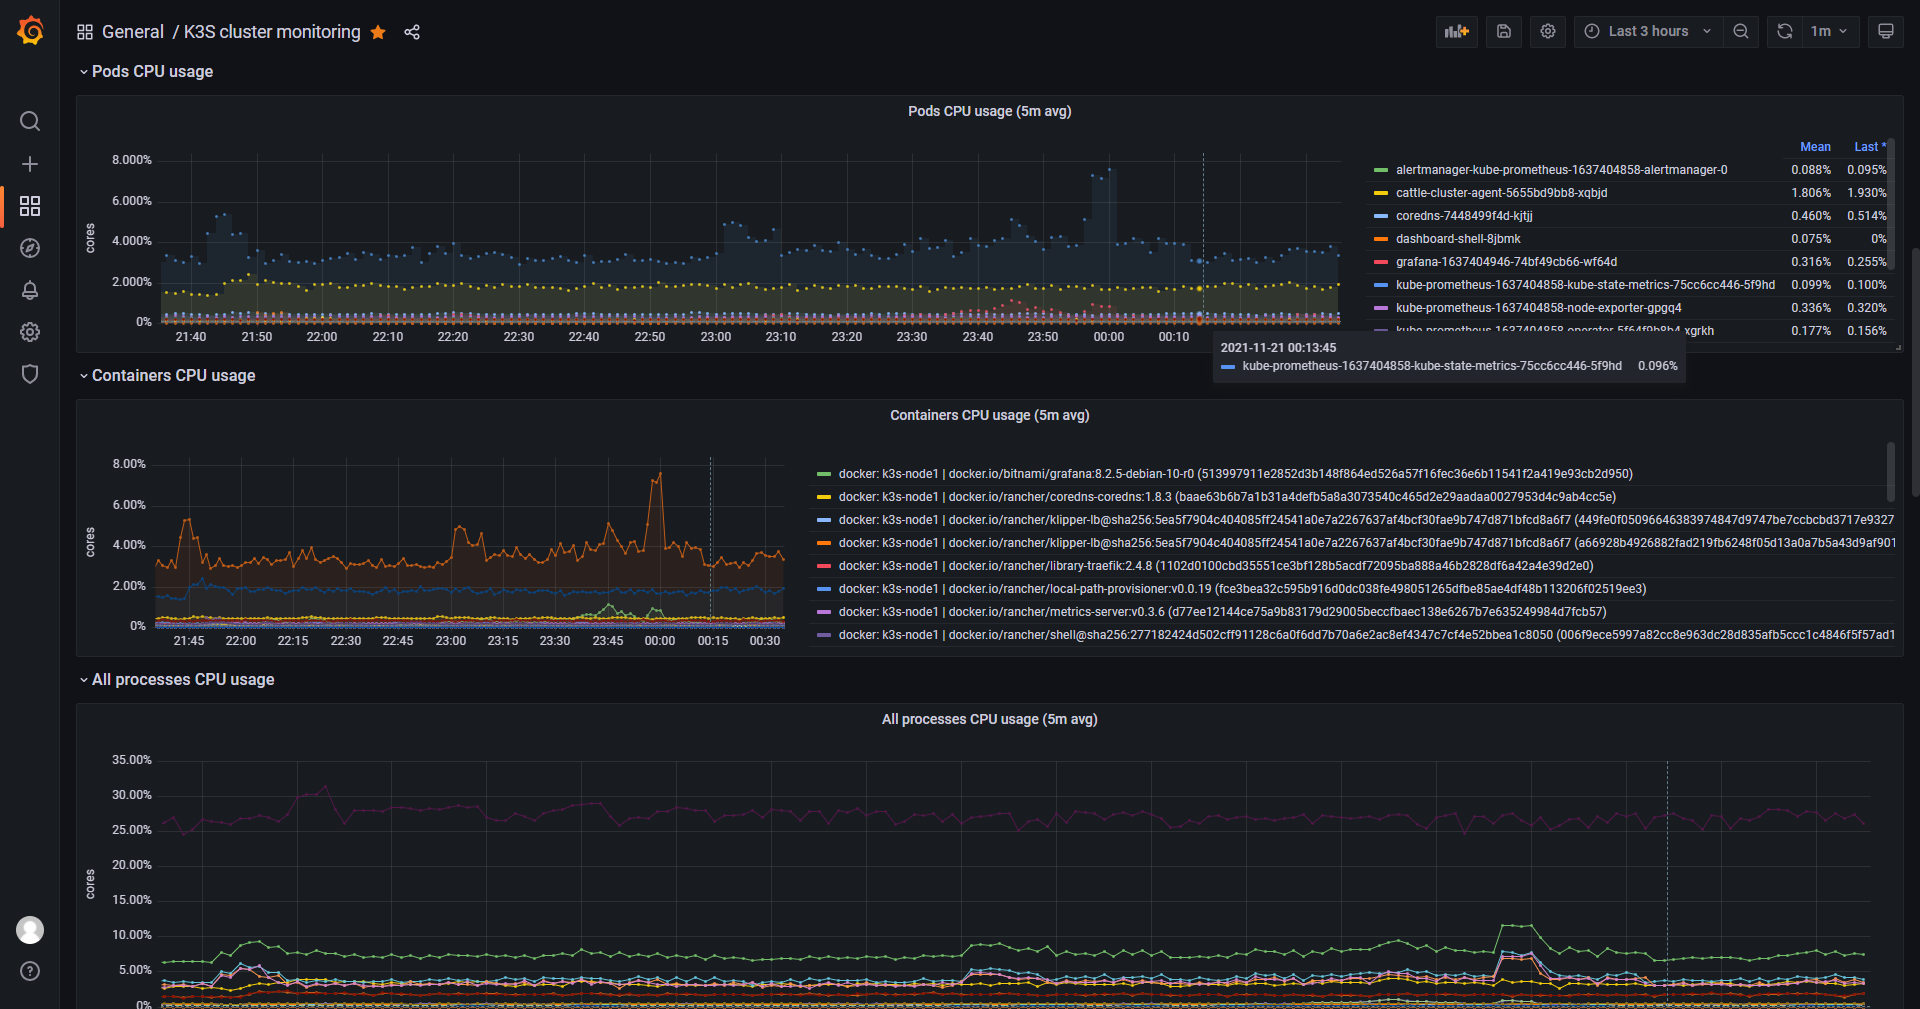
This dashboard monitors a K3S cluster’s resource utilization at both cluster and namespace levels, including CPU, memory, filesystem, and network I/O. It highlights key metrics such as container_memory_usage_bytes, container_cpu_usage_seconds_total, and container_network_receive_bytes_total, providing per-namespace views for CPU and memory usage, plus overall pod/container activity and I/O pressure to identify bottlenecks and capacity trends.
Screenshots
Used Metrics 1010
Get Dashboard✕
Download
Copy to Clipboard