K8 Deployment 47,15247,152
Description
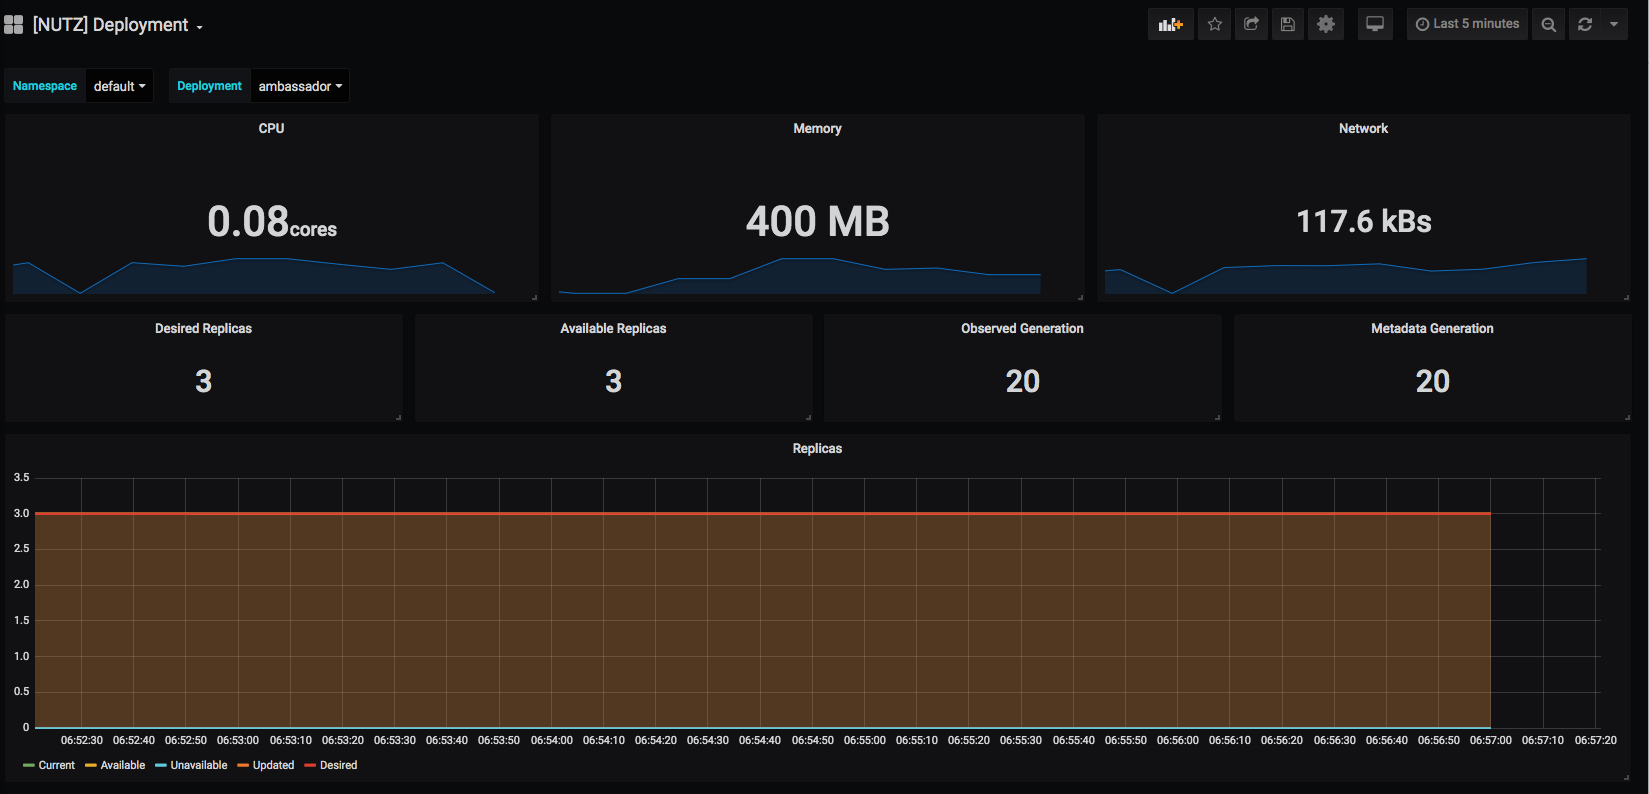
This dashboard monitors Kubernetes deployment health and resource usage, focusing on how replicas align with the desired state and how efficiently pods are consuming resources. It highlights core metrics like container_cpu_usage_seconds_total, container_memory_working_set_bytes, and kube_deployment_status_replicas_available to surface CPU/memory trends and replica availability, while also exposing deployment state through kube_deployment_status_observed_generation, kube_deployment_metadata_generation, and kube_deployment_spec_replicas for change verification and rollout progress.
Screenshots
Used Metrics 1111
-
container_cpu_usage_seconds_total
-
container_memory_working_set_bytes
-
container_network_receive_bytes_total
-
container_network_transmit_bytes_total
kube_deployment_metadata_generation
kube_deployment_spec_replicas
kube_deployment_status_observed_generation
kube_deployment_status_replicas
kube_deployment_status_replicas_available
kube_deployment_status_replicas_unavailable
kube_deployment_status_replicas_updated