K8 StatefulSet 44,69744,697
Description
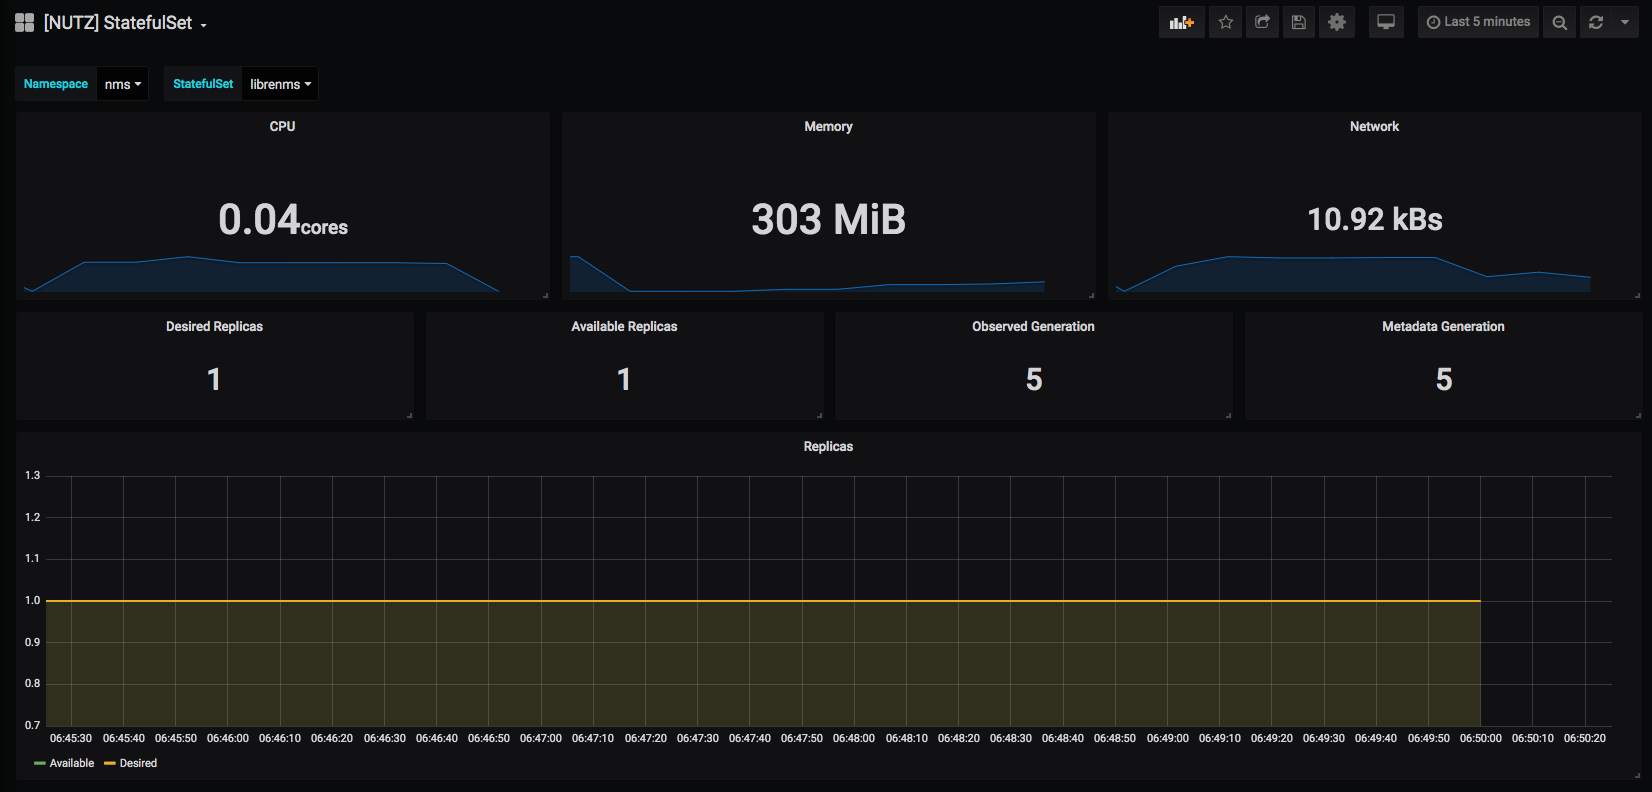
Monitors the health and activity of StatefulSets in Kubernetes, pulling from core metrics to track resource usage, replica status, and deployment fidelity. Key metrics include container_cpu_usage_seconds_total, container_memory_working_set_bytes, and kube_statefulset_replicas (along with status fields like kube_statefulset_status_observed_generation and kube_statefulset_metadata_generation to surface drift and rollout progress). The dashboard highlights CPU/Memory consumption, Network traffic, and replica consistency, with panels for Desired Replicas, Available Replicas, and Observed/Metadata Generation to detect underprovisioning or incomplete rollouts.
Screenshots
Used Metrics 88
-
container_cpu_usage_seconds_total
-
container_memory_working_set_bytes
-
container_network_receive_bytes_total
-
container_network_transmit_bytes_total
kube_statefulset_metadata_generation
kube_statefulset_replicas
kube_statefulset_status_observed_generation
kube_statefulset_status_replicas