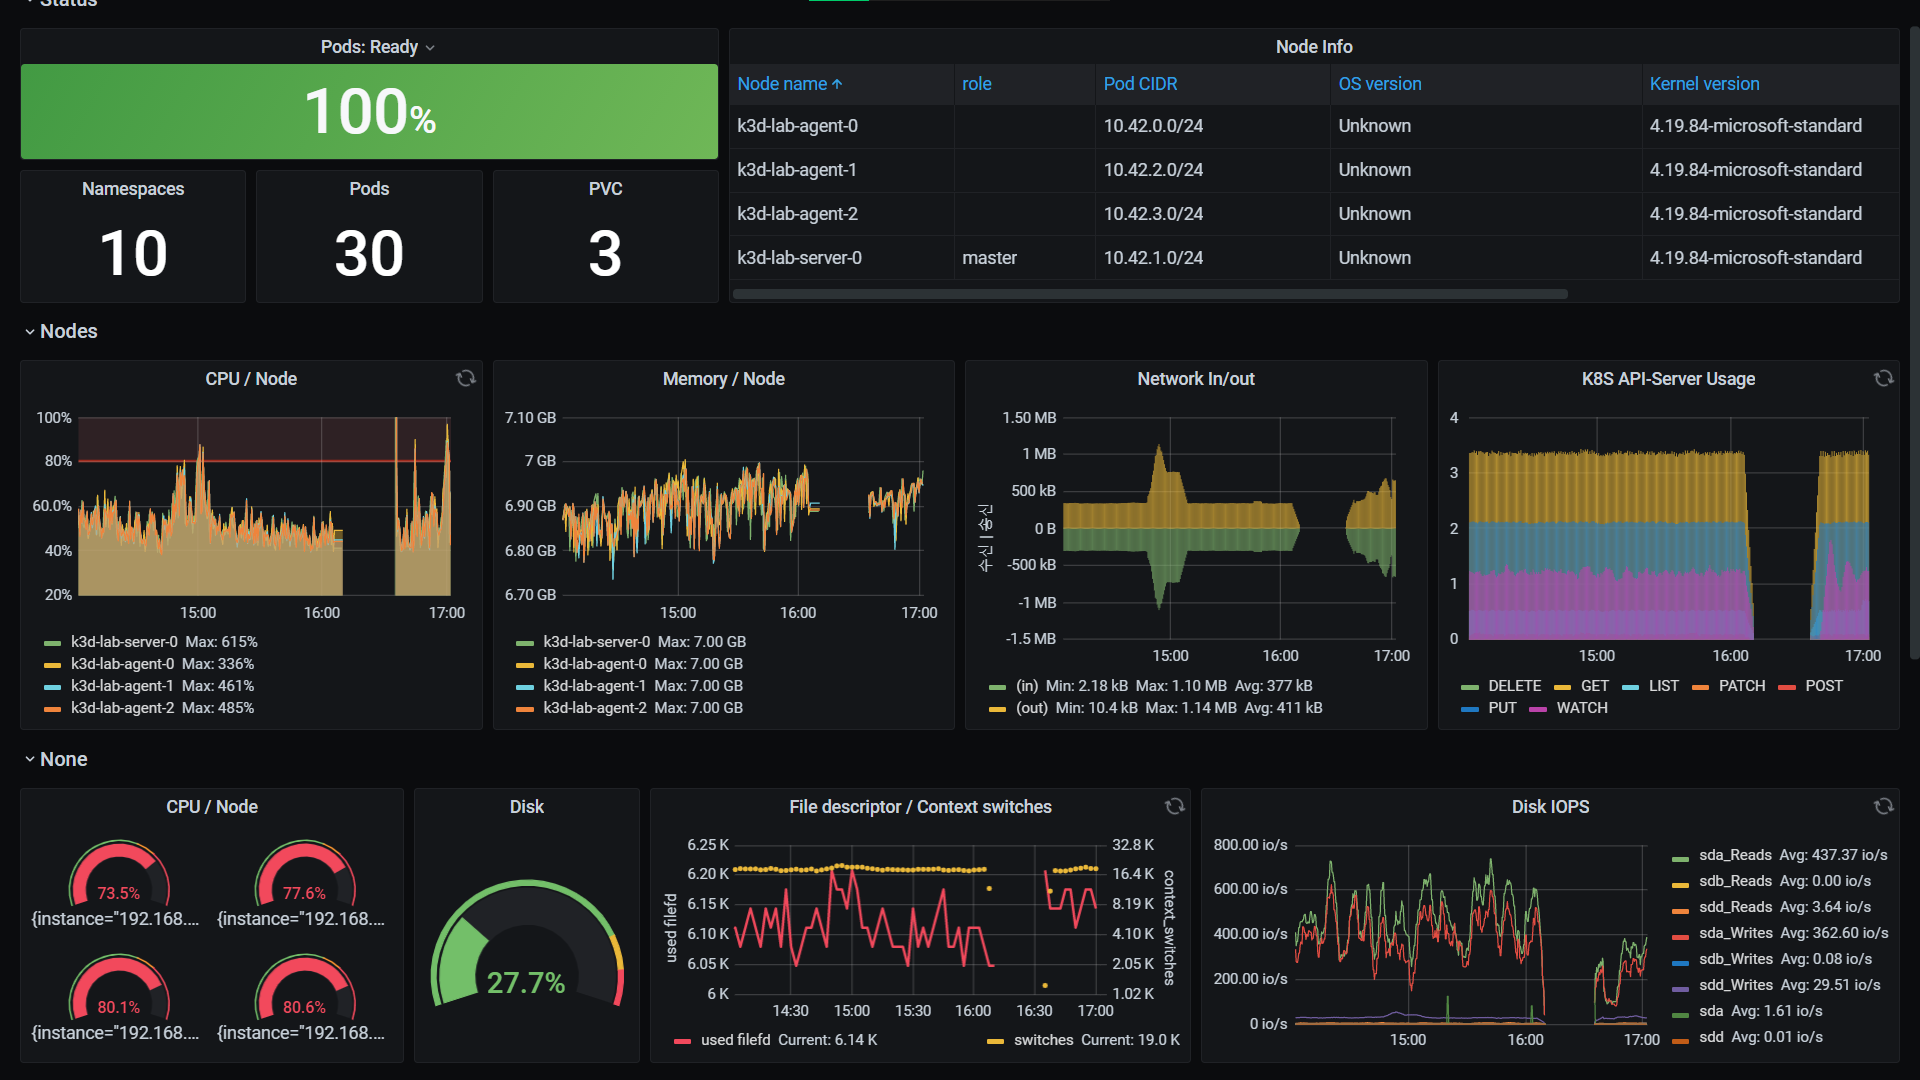
K8S Cluster Monitor 4,2674,267 3.0 (1 reviews)
Description
English version of an Asian dashboard found on grafana.com/dashboards
Screenshots
Used Metrics 4343
apiserver_request_total
-
container_cpu_usage_seconds_total
-
container_fs_usage_bytes
-
container_memory_usage_bytes
-
container_network_receive_bytes_total
-
container_network_transmit_bytes_total
container_spec_memory_reservation_limit_bytes
-
container_threads
duration
duration:
instance
instance:node_cpu:ratio
kube_namespace_created
kube_node_info
kube_node_role
kube_node_status_capacity
kube_persistentvolumeclaim_info
kube_pod_container_resource_limits_cpu_cores
kube_pod_container_resource_limits_memory_bytes
kube_pod_container_status_ready
kube_pod_container_status_restarts_total
kube_pod_container_status_waiting_reason
kube_pod_start_time
kubelet_node_name
kubelet_running_pod_count
kubernetes_node
node
-
node_boot_time_seconds
-
node_context_switches_total
-
node_cpu_seconds_total
-
node_disk_io_now
-
node_disk_reads_completed_total
-
node_disk_writes_completed_total
-
node_filefd_allocated
-
node_filesystem_avail_bytes
-
node_filesystem_size_bytes
-
node_memory_MemAvailable_bytes
-
node_memory_MemTotal_bytes
-
node_network_receive_bytes_total
-
node_network_transmit_bytes_total
-
node_uname_info
nodename
-
up