K8S Dashboard 29,711,98729,711,987
Description
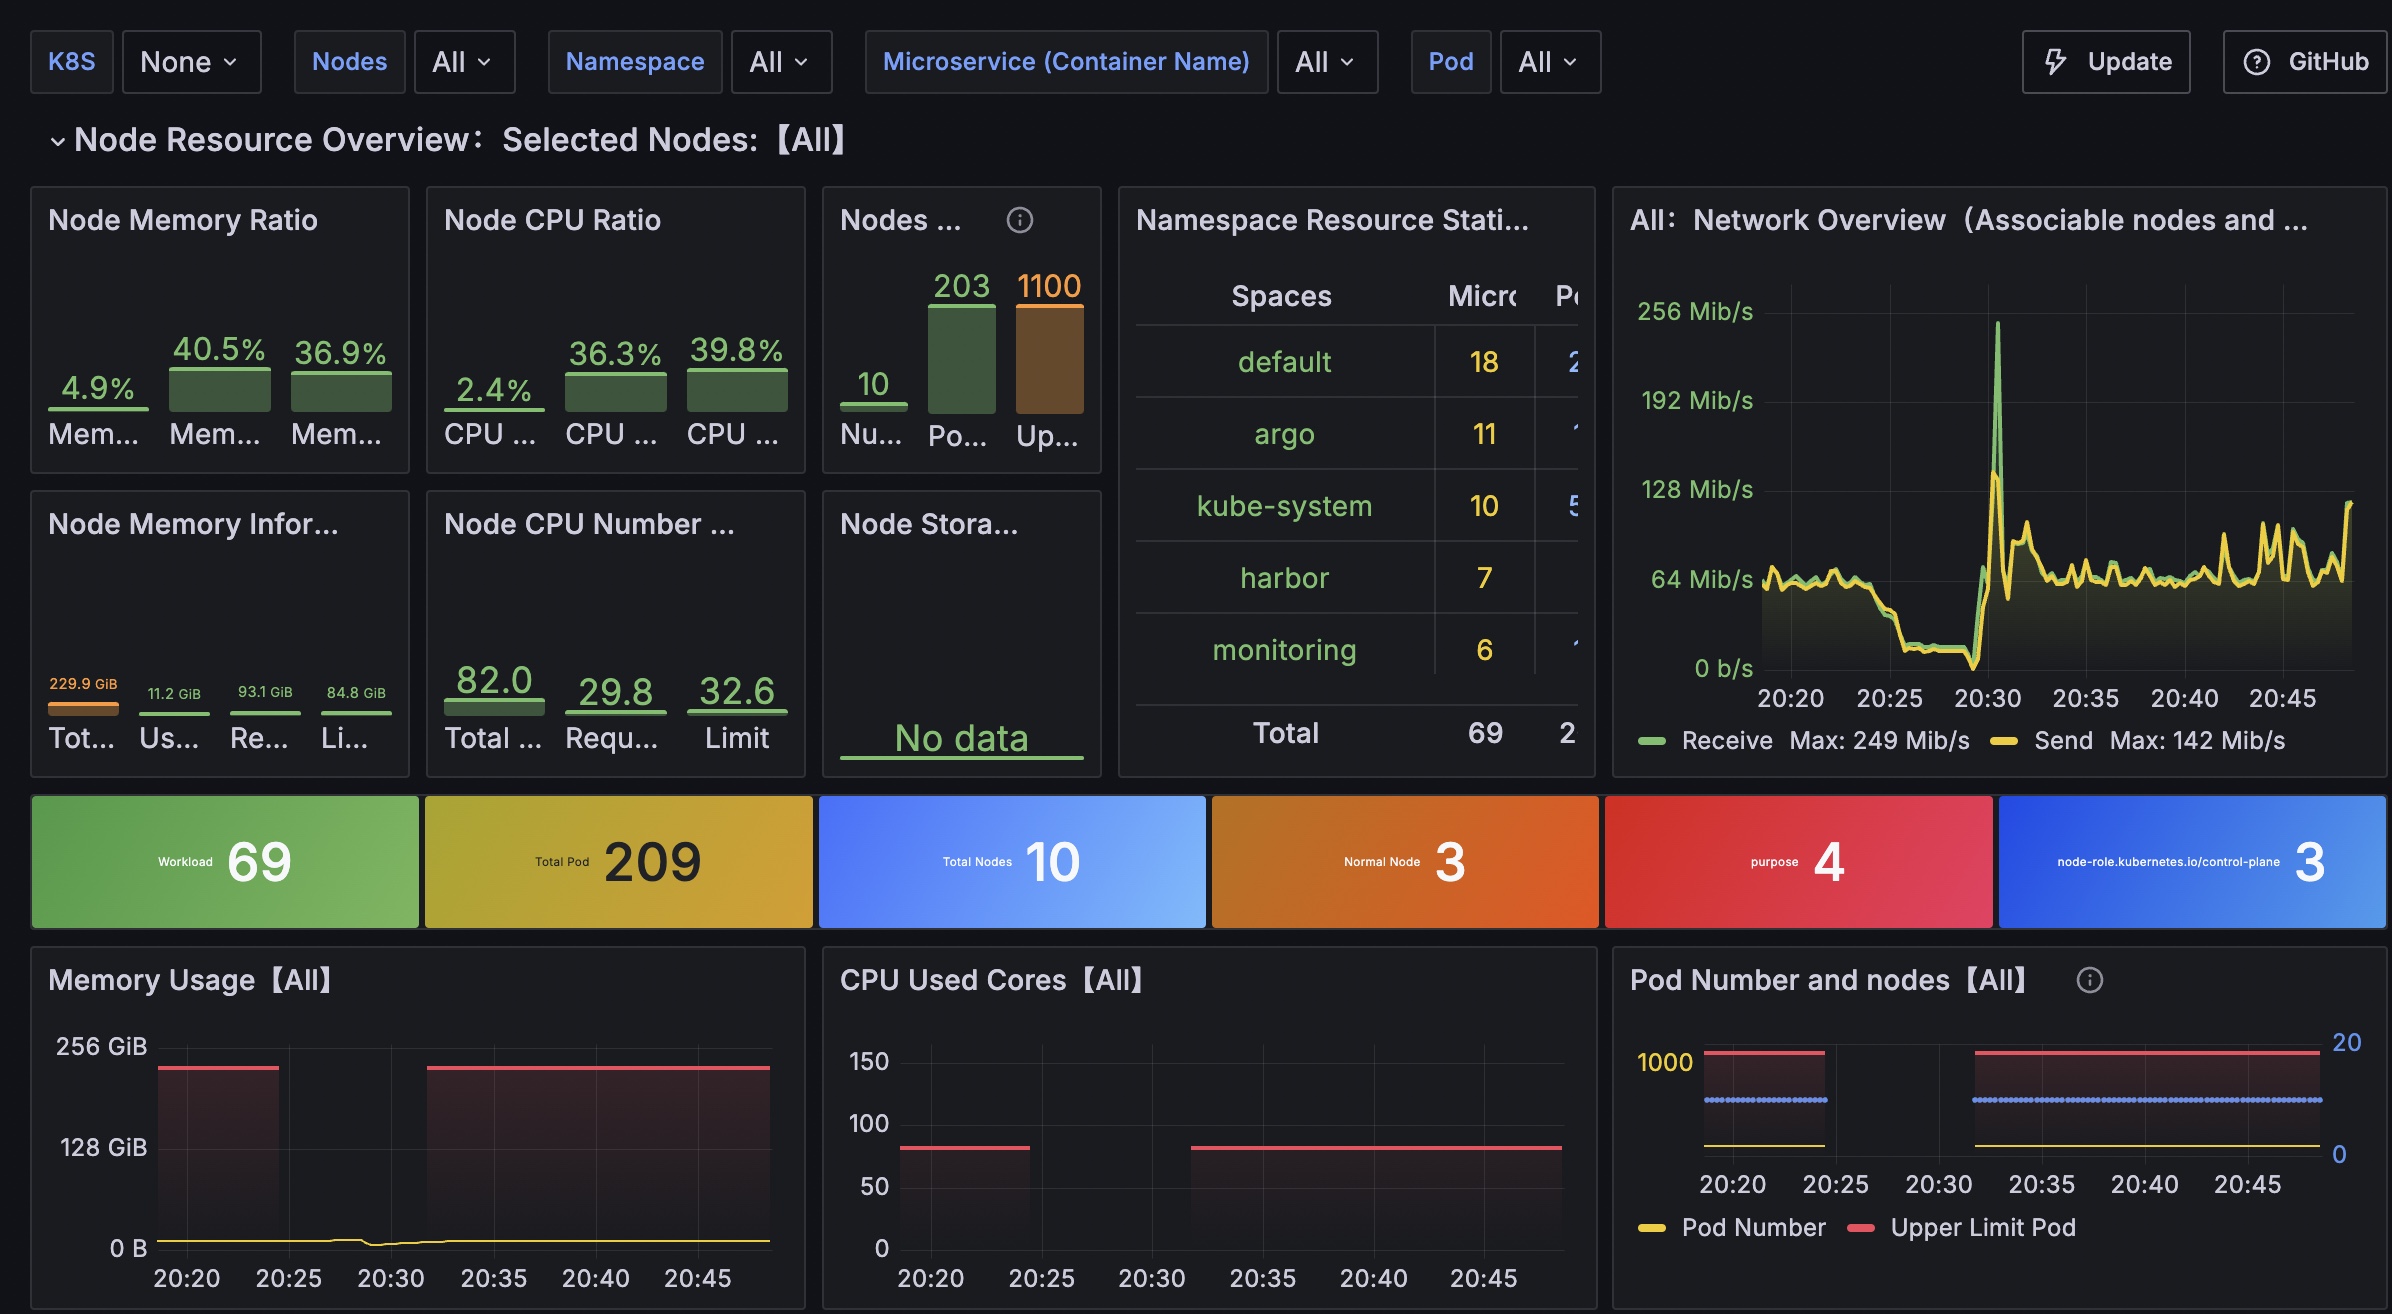
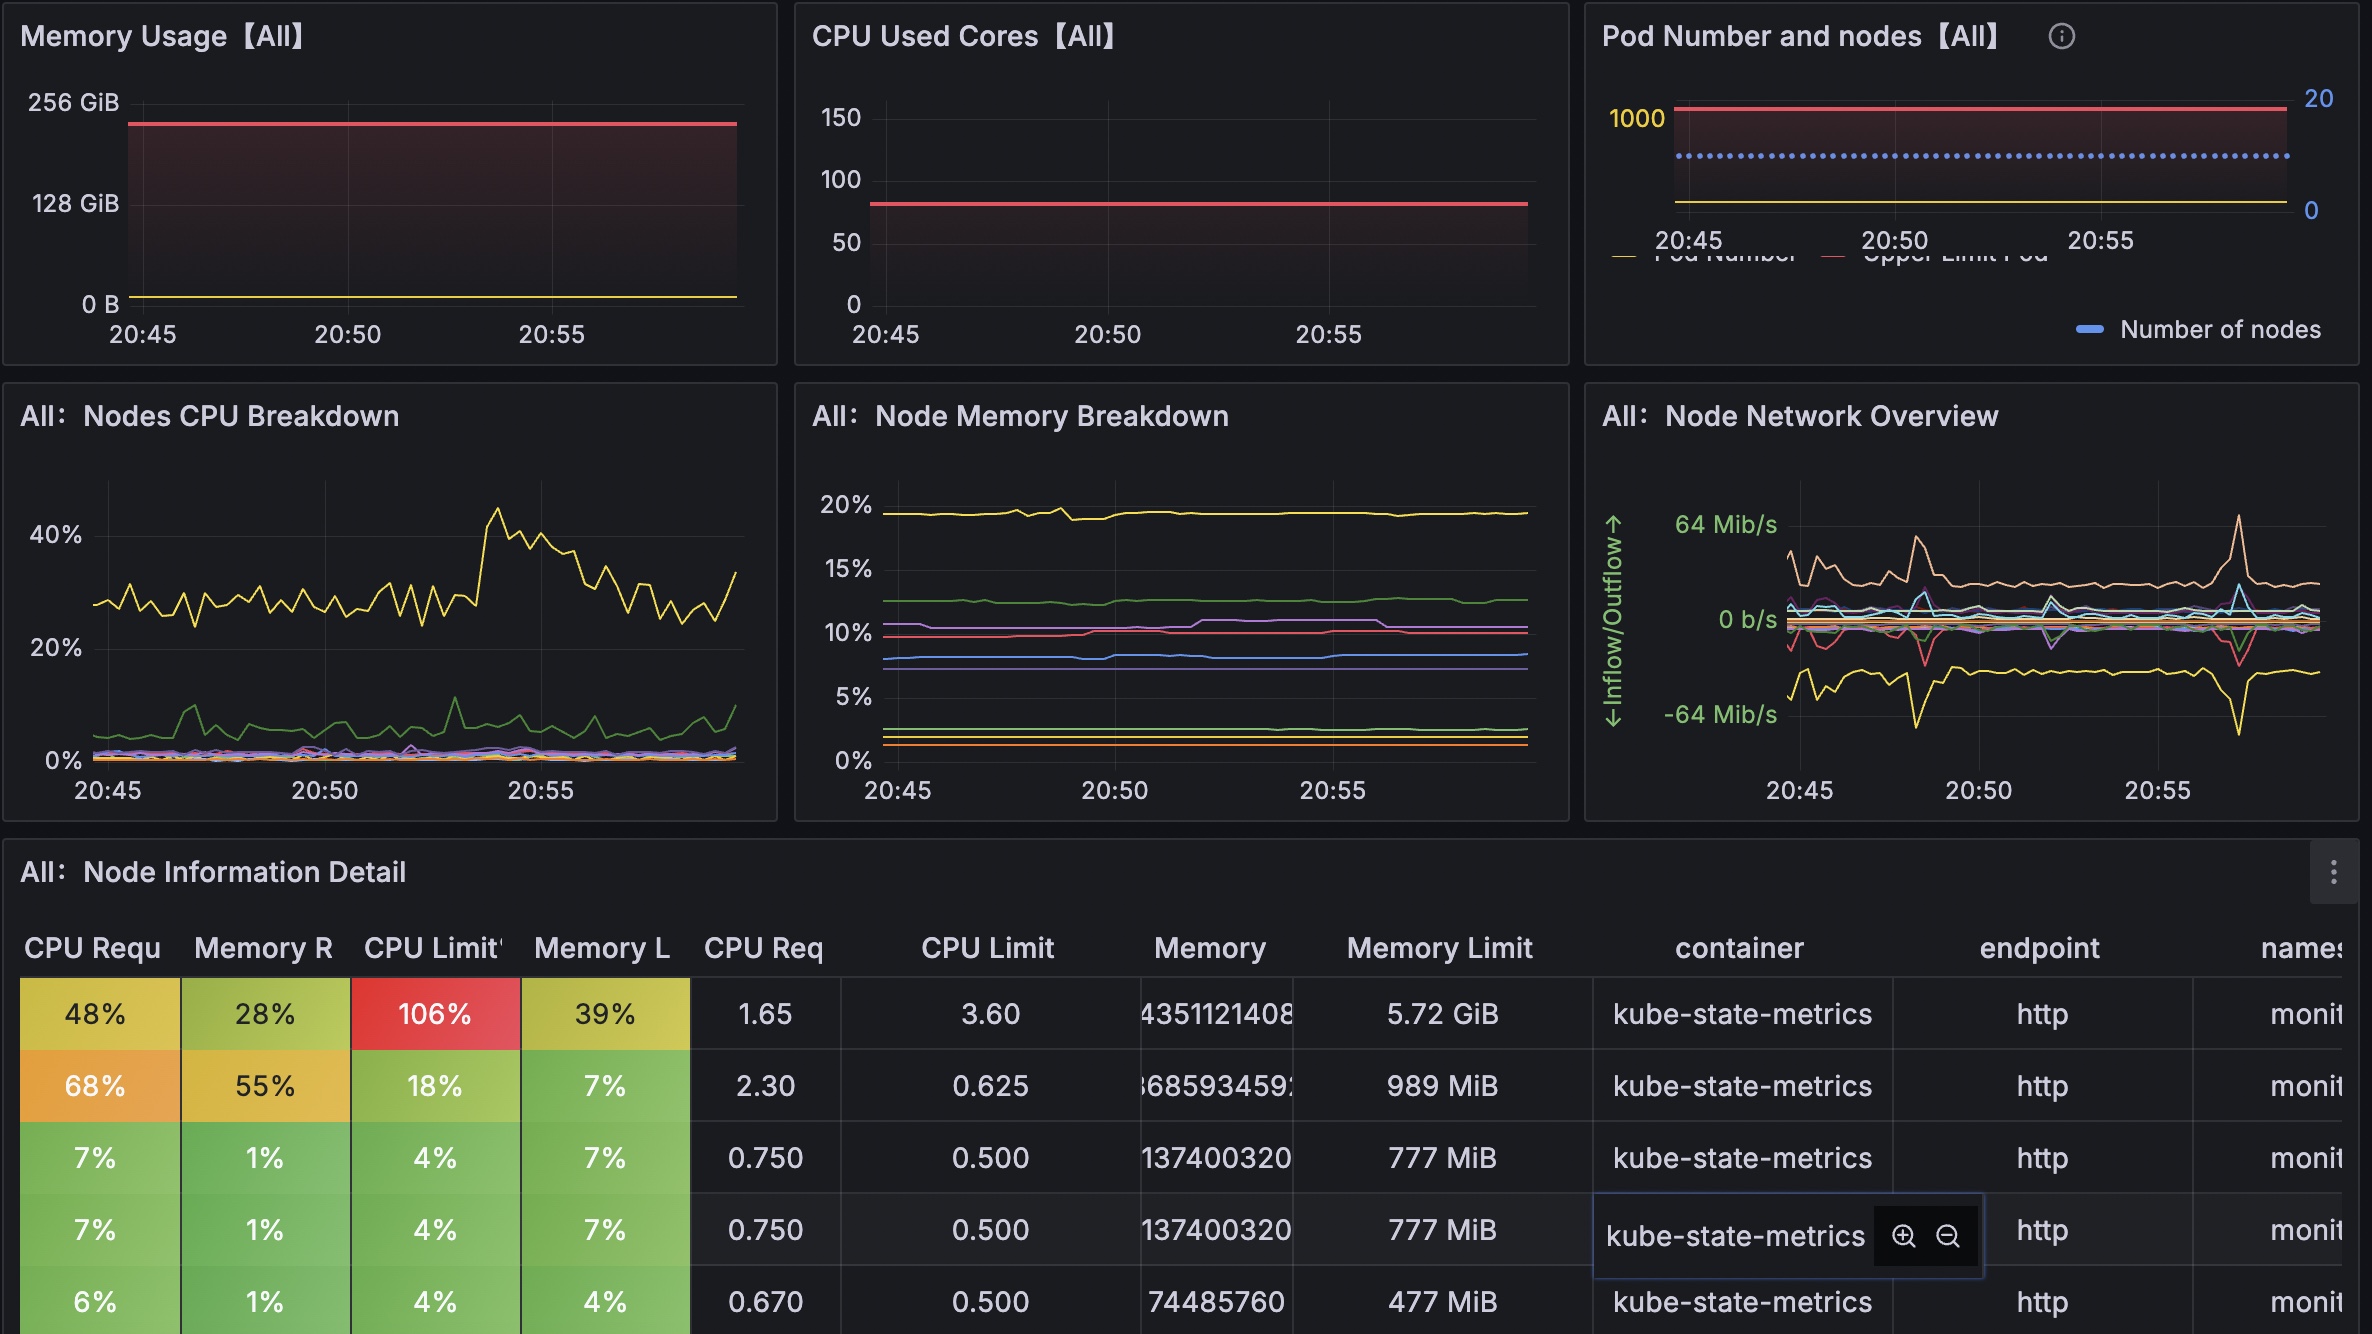
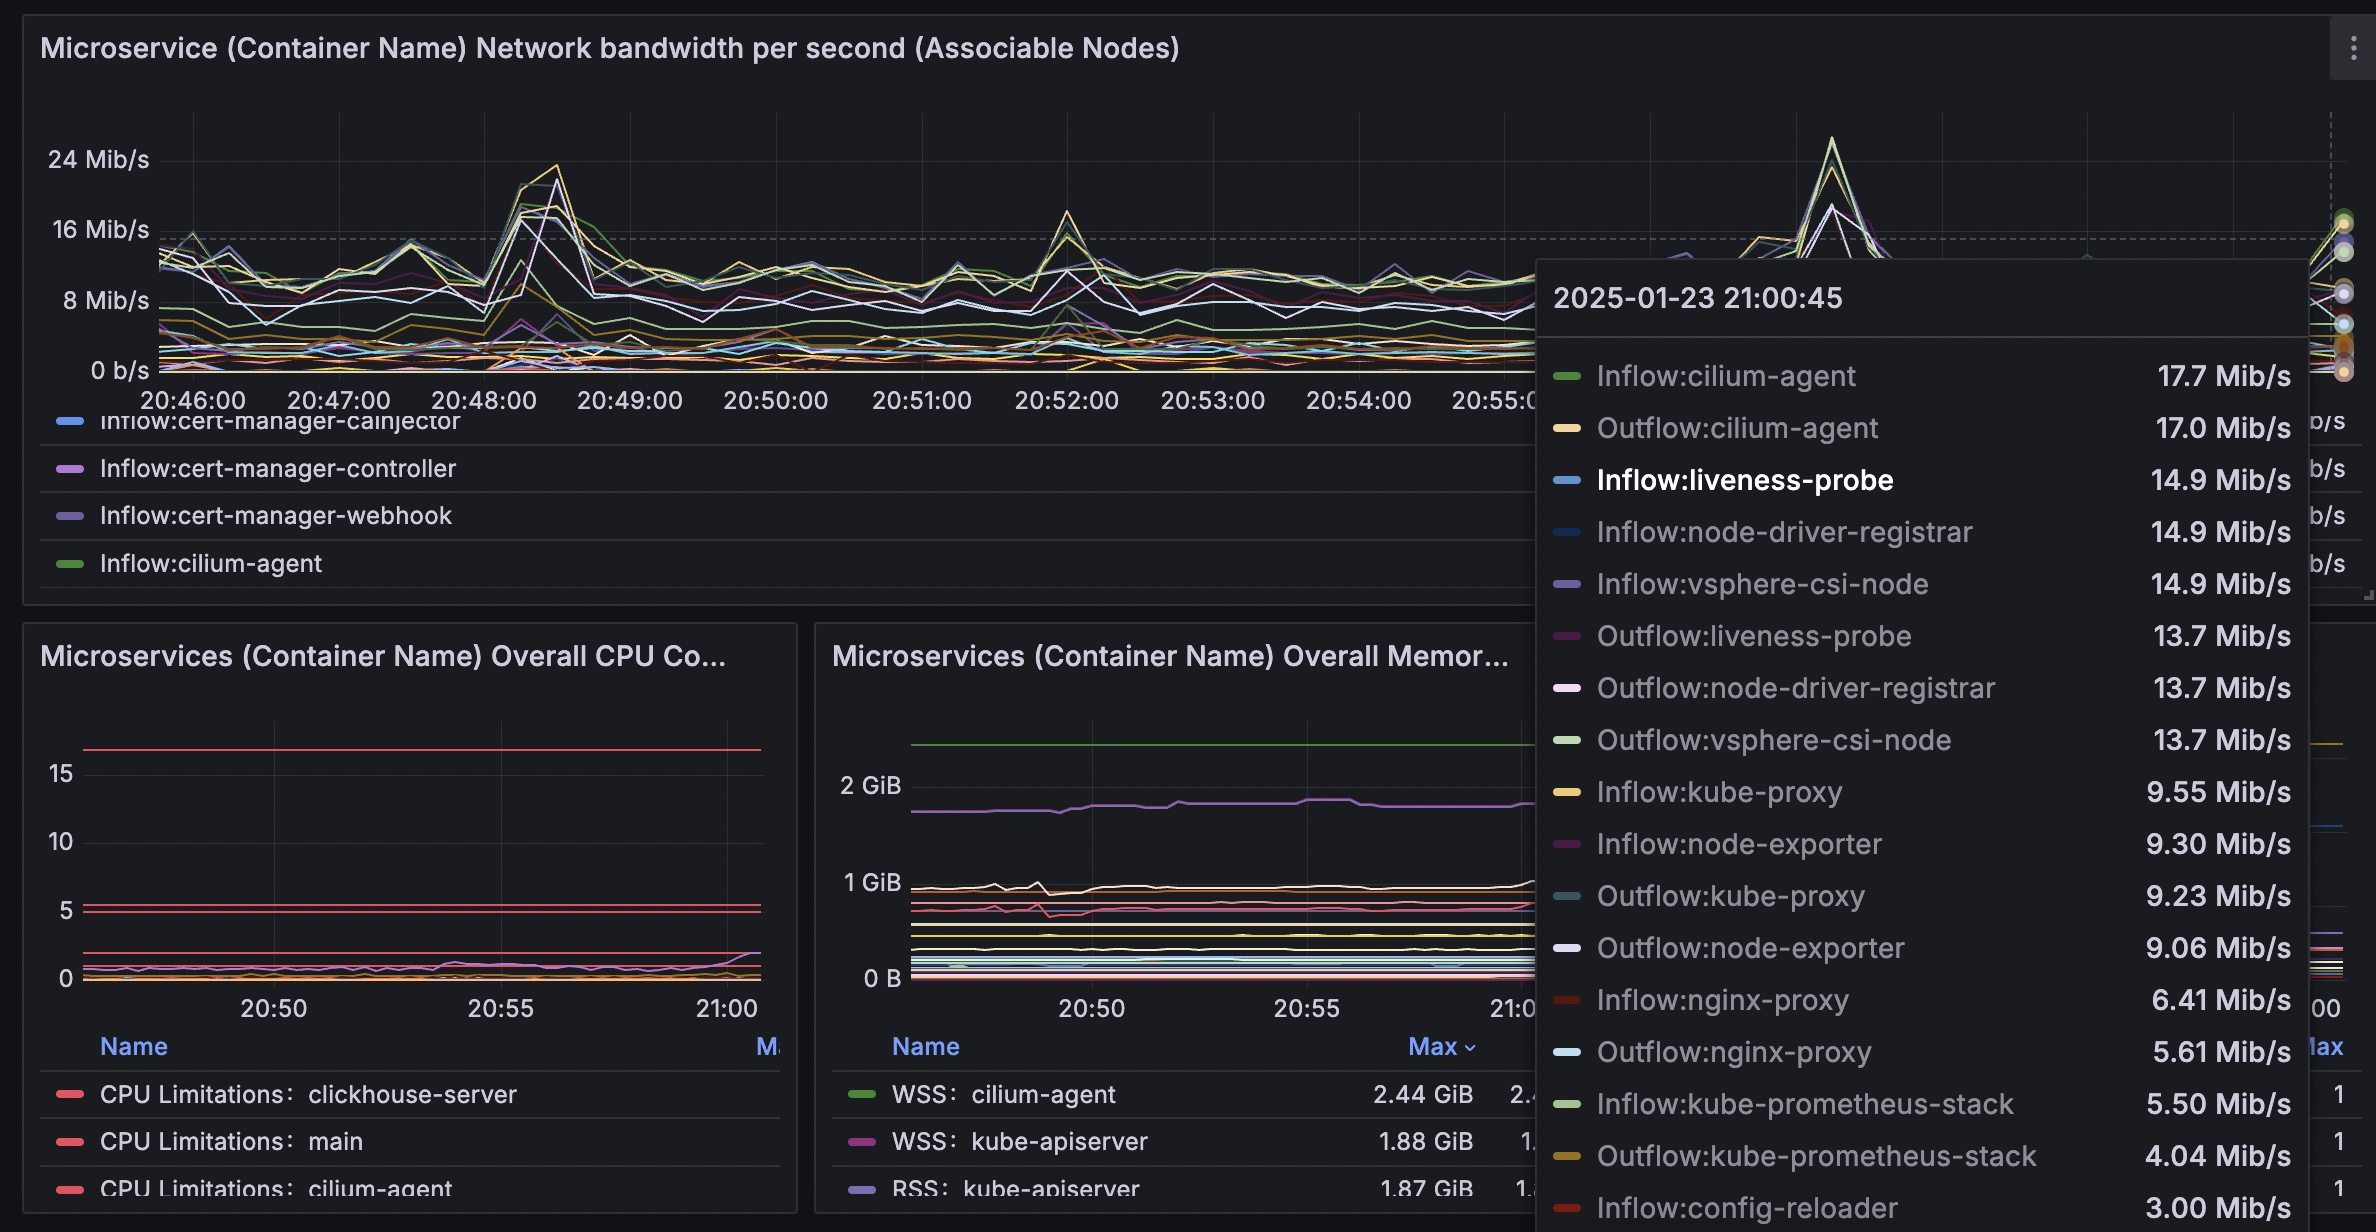
K8S Dashboard provides an at-a-glance view of cluster health and resource usage across nodes, namespaces, and pods. It combines hardware/allocatable metrics, per-node and per-namespace resource consumptions, and detailed workload insights (memory, CPU, storage, and network) with associable filters to correlate nodes, namespaces, and pods for capacity planning and anomaly detection.
Screenshots
Used Metrics 2929
cass_jvm_heap
cass_jvm_heap_max
-
container_cpu_usage_seconds_total
-
container_fs_limit_bytes
-
container_fs_usage_bytes
-
container_memory_rss
-
container_memory_working_set_bytes
-
container_network_receive_bytes_total
-
container_network_transmit_bytes_total
-
container_spec_cpu_quota
container_spec_memory_limit_bytes
kube_configmap_info
kube_node_info
kube_node_spec_taint
kube_node_status_allocatable
kube_node_status_condition
kube_pod_container_info
kube_pod_container_resource_limits
kube_pod_container_resource_requests
kube_pod_container_status_restarts_total
kube_pod_created
kube_pod_info
kube_pod_spec_volumes_persistentvolumeclaims_info
kube_secret_info
kube_service_info
kubelet_volume_stats_available_bytes
kubelet_volume_stats_used_bytes
node
service