K8s / Storage / Volumes / Cluster 23,823,23923,823,239 4.0 (2 reviews)
12/21/2019
12/22/2019
14
>=6.5.2
Prometheus
Description
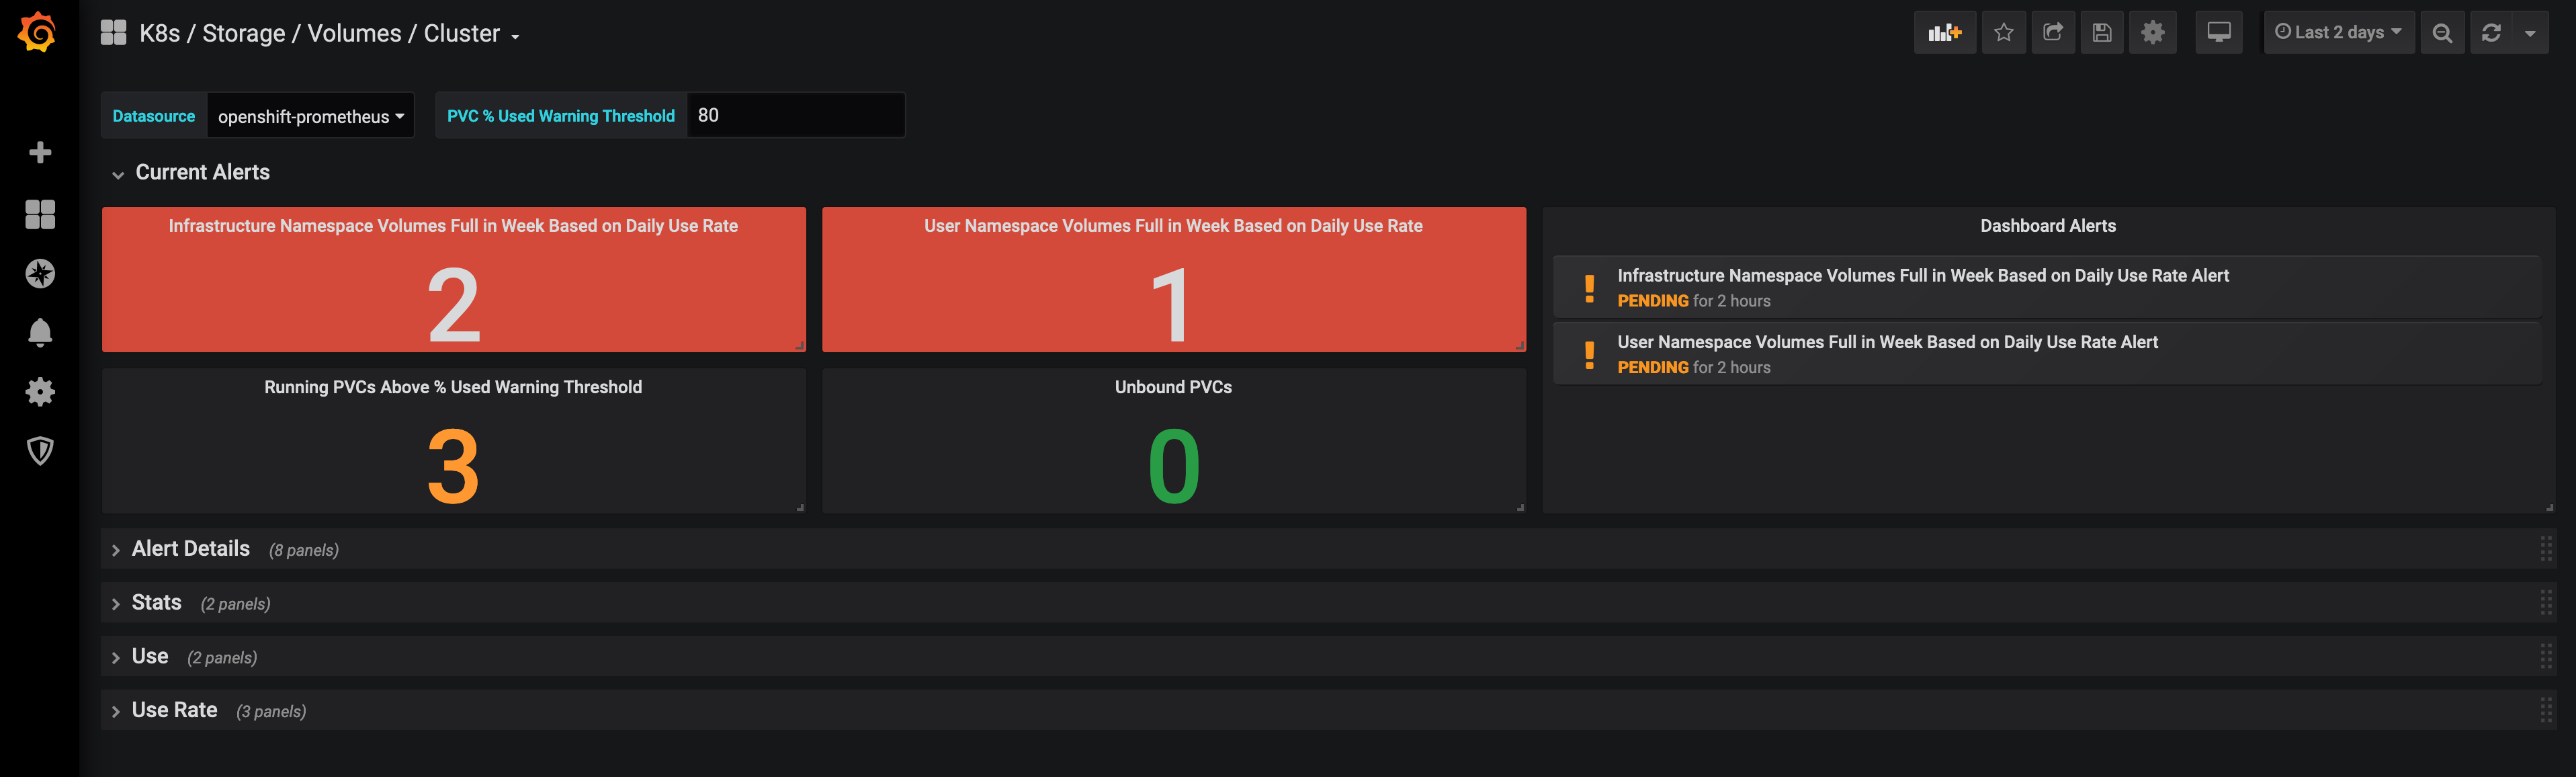
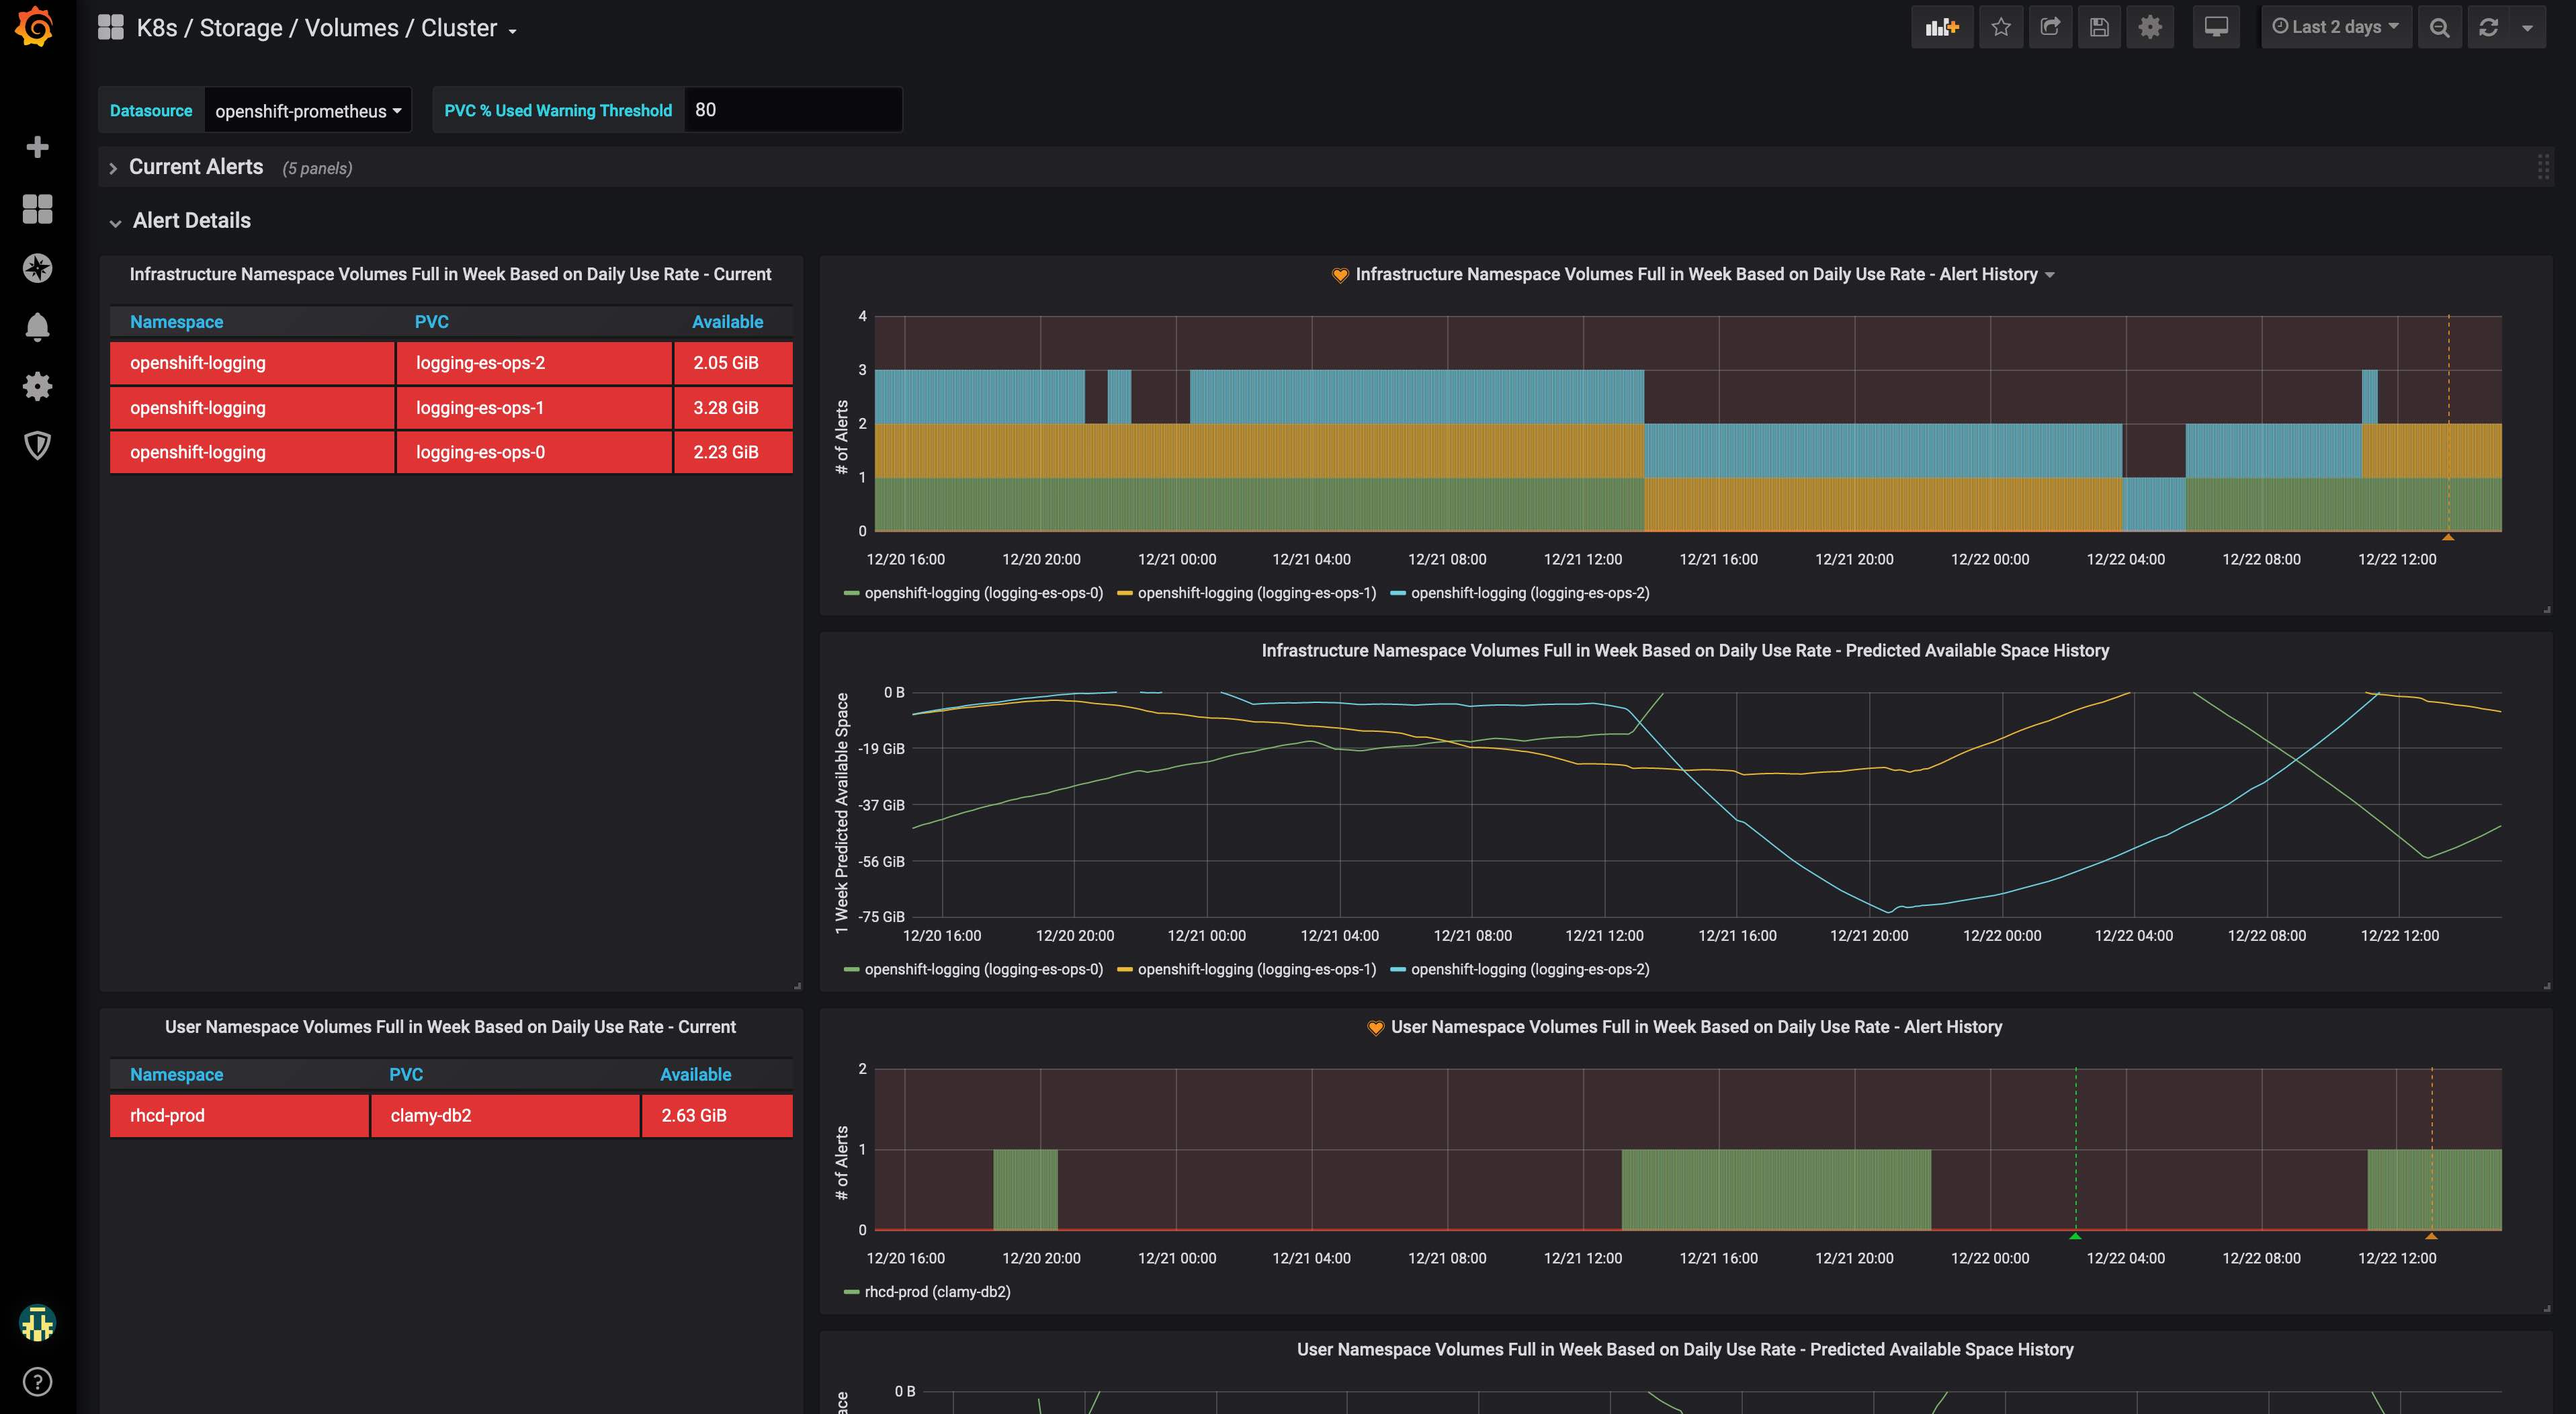
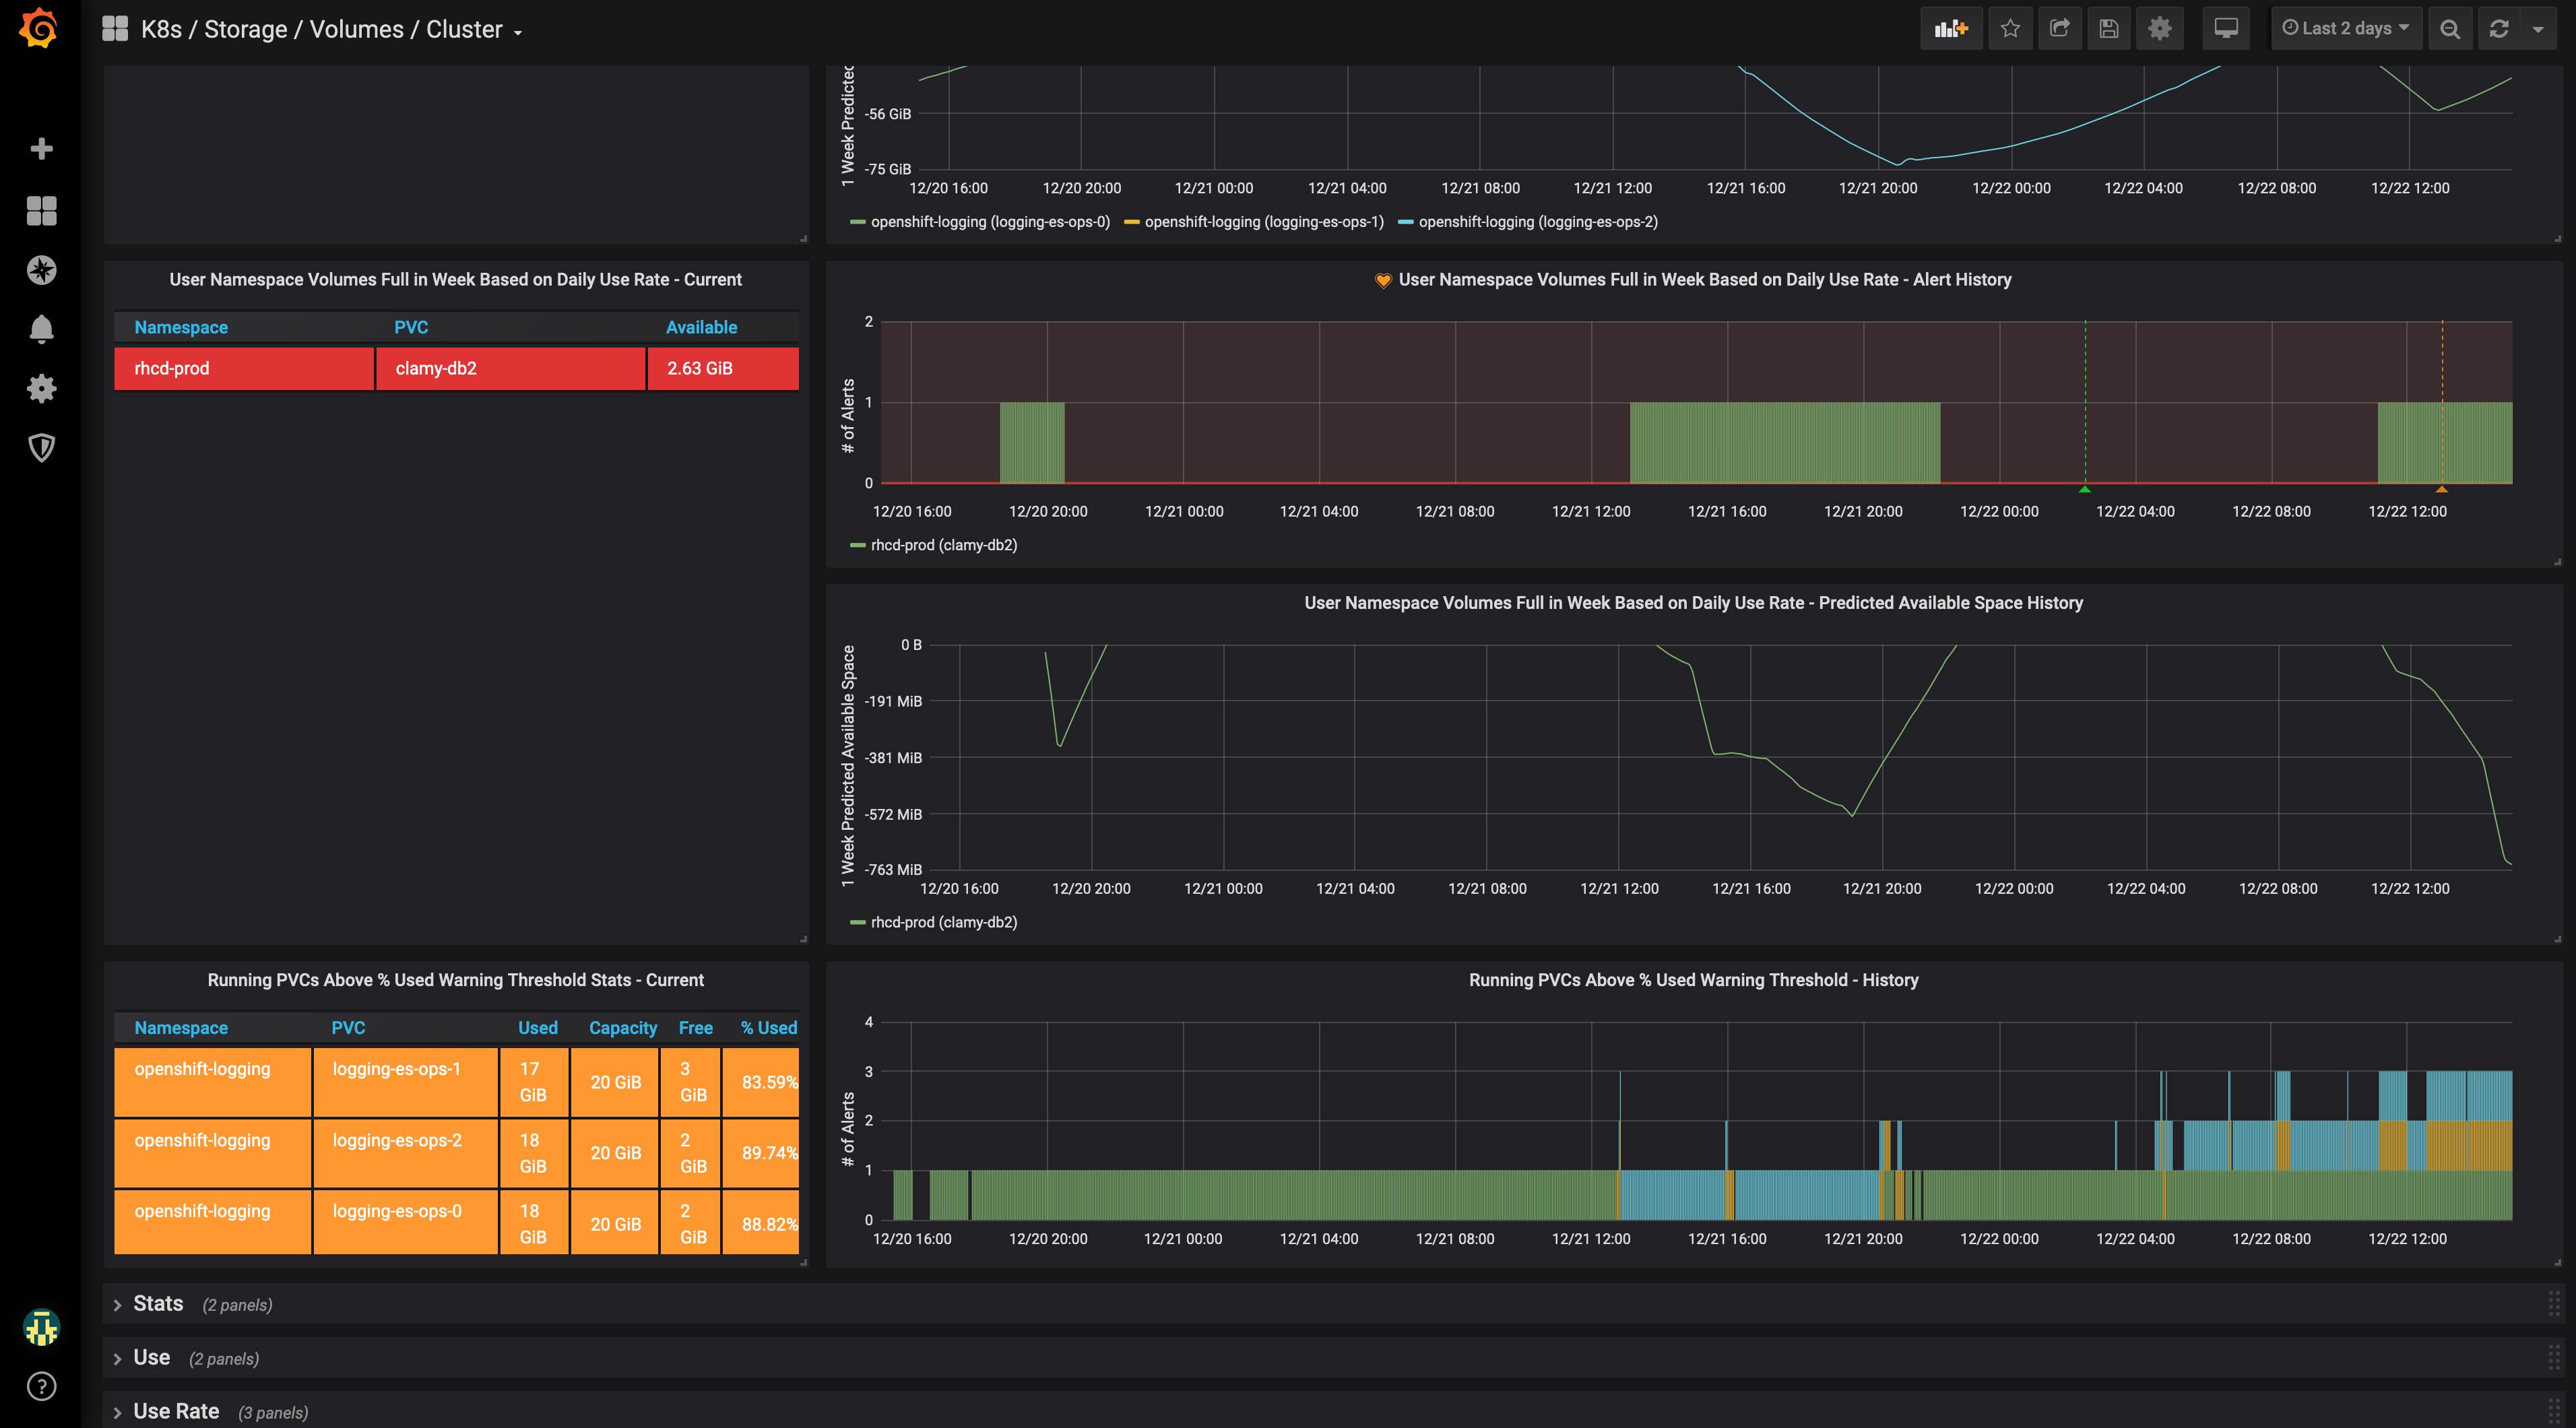
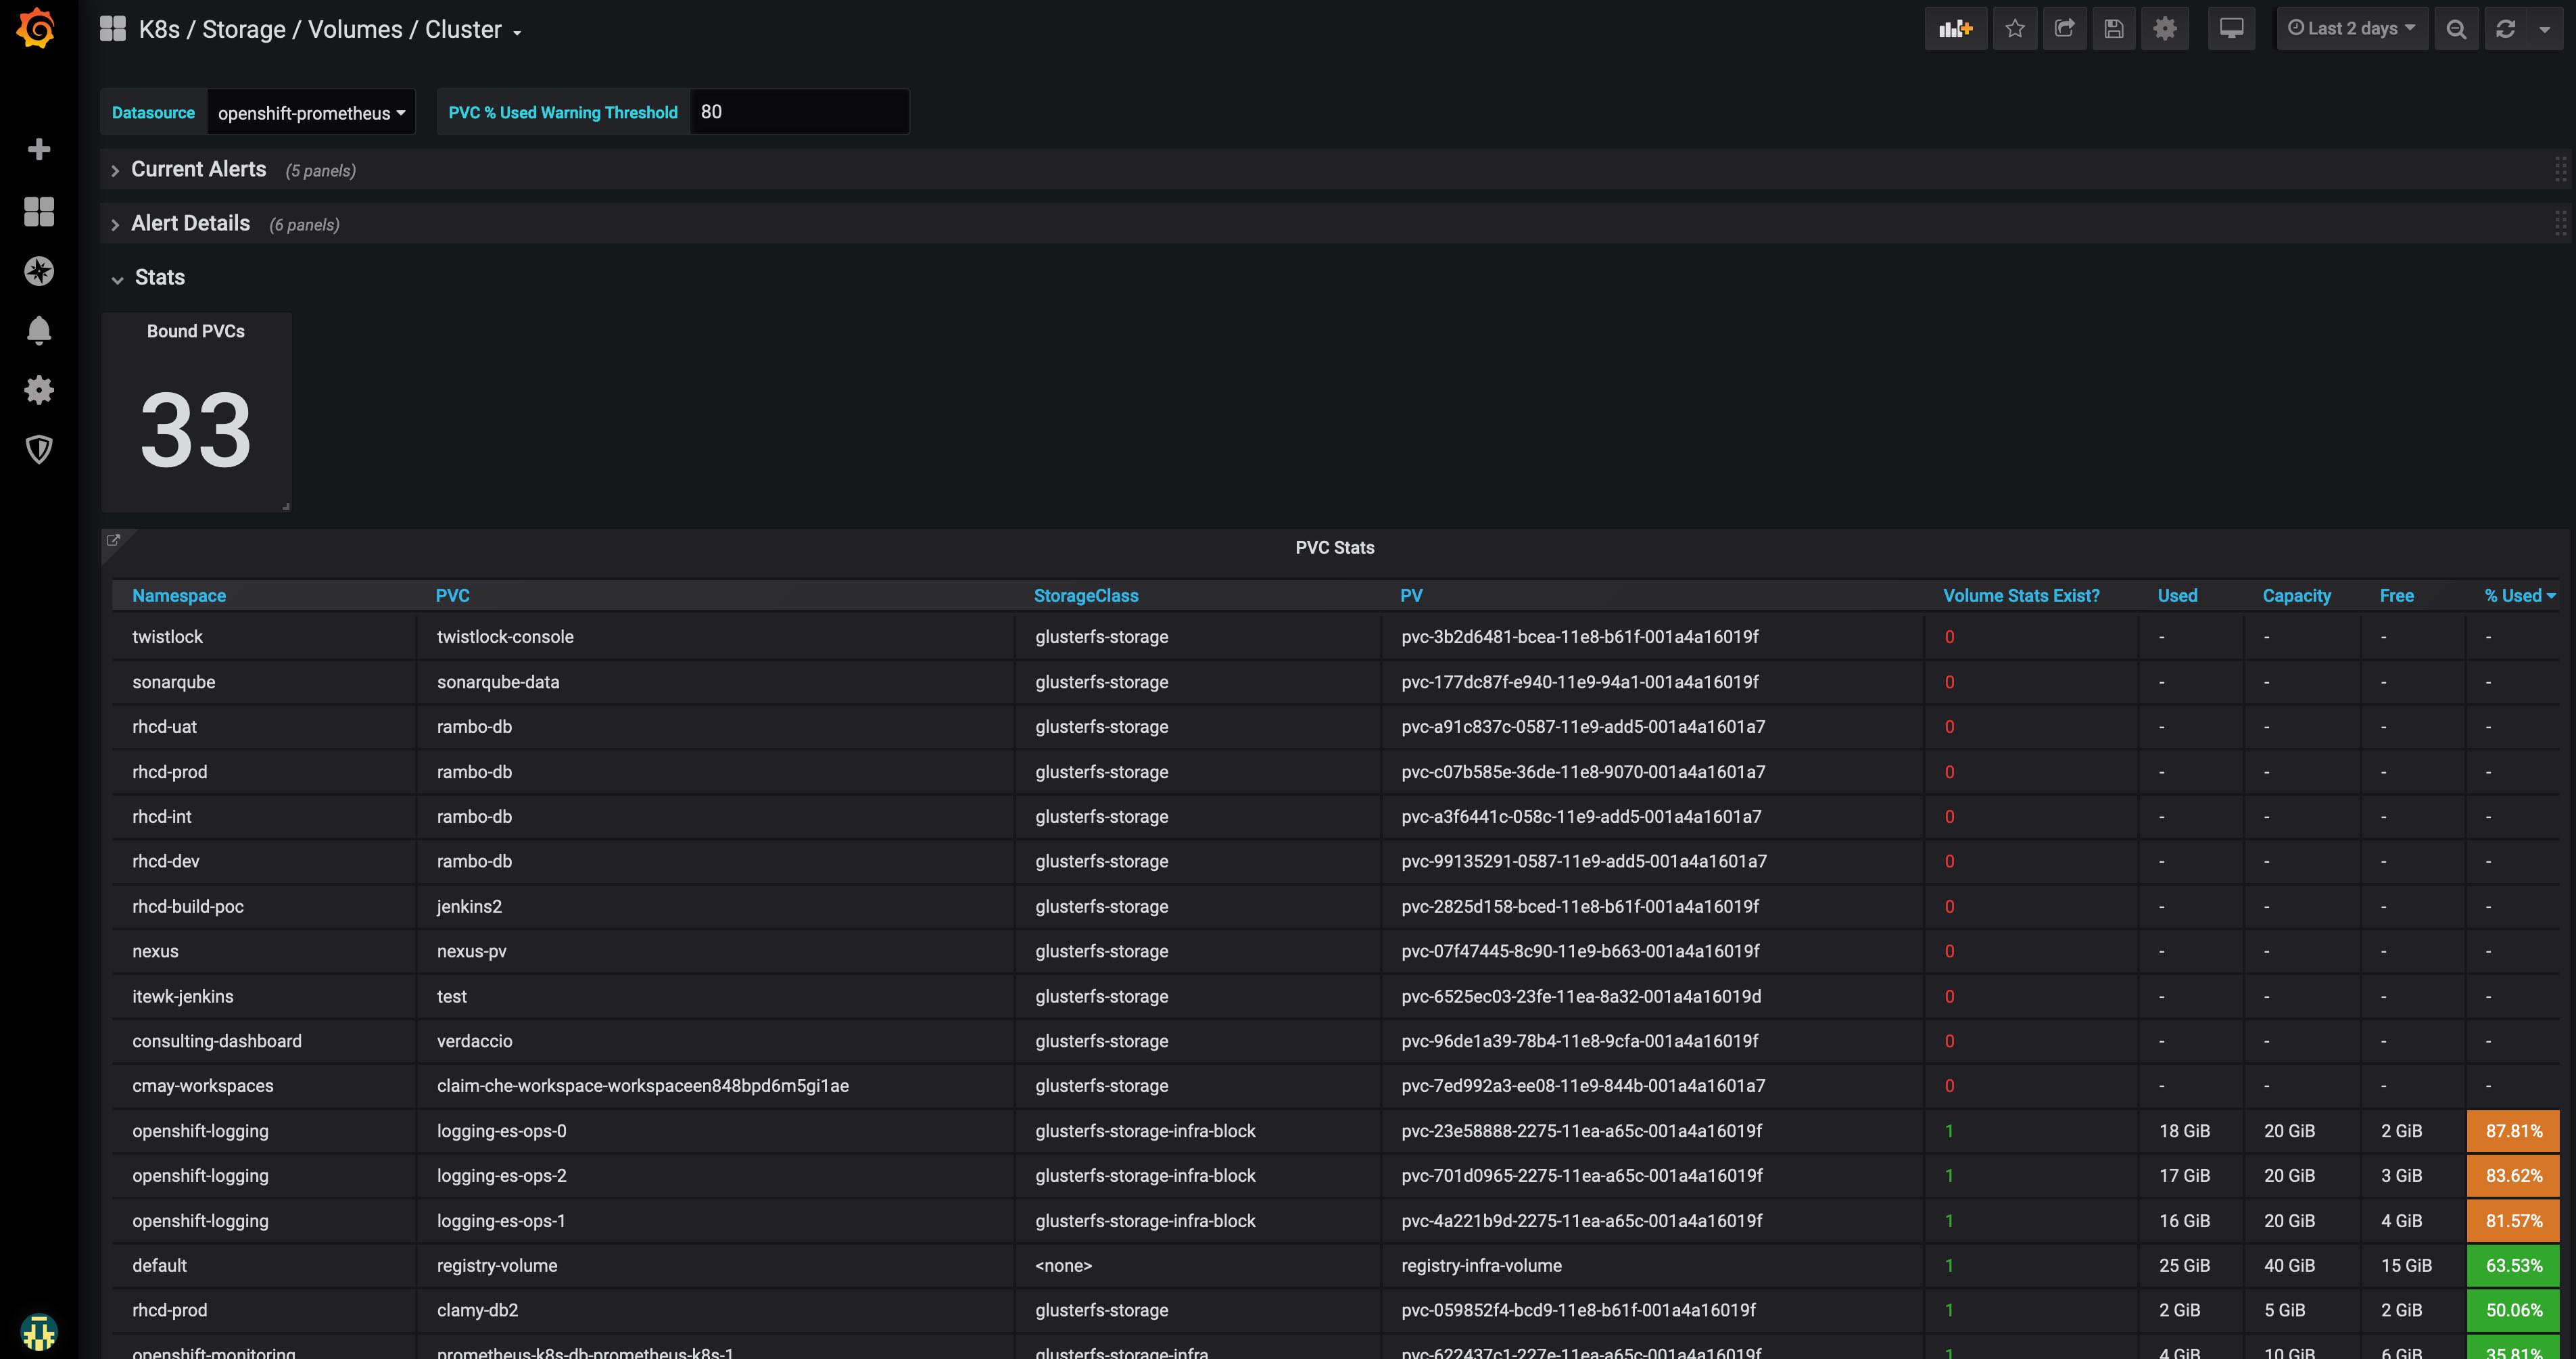
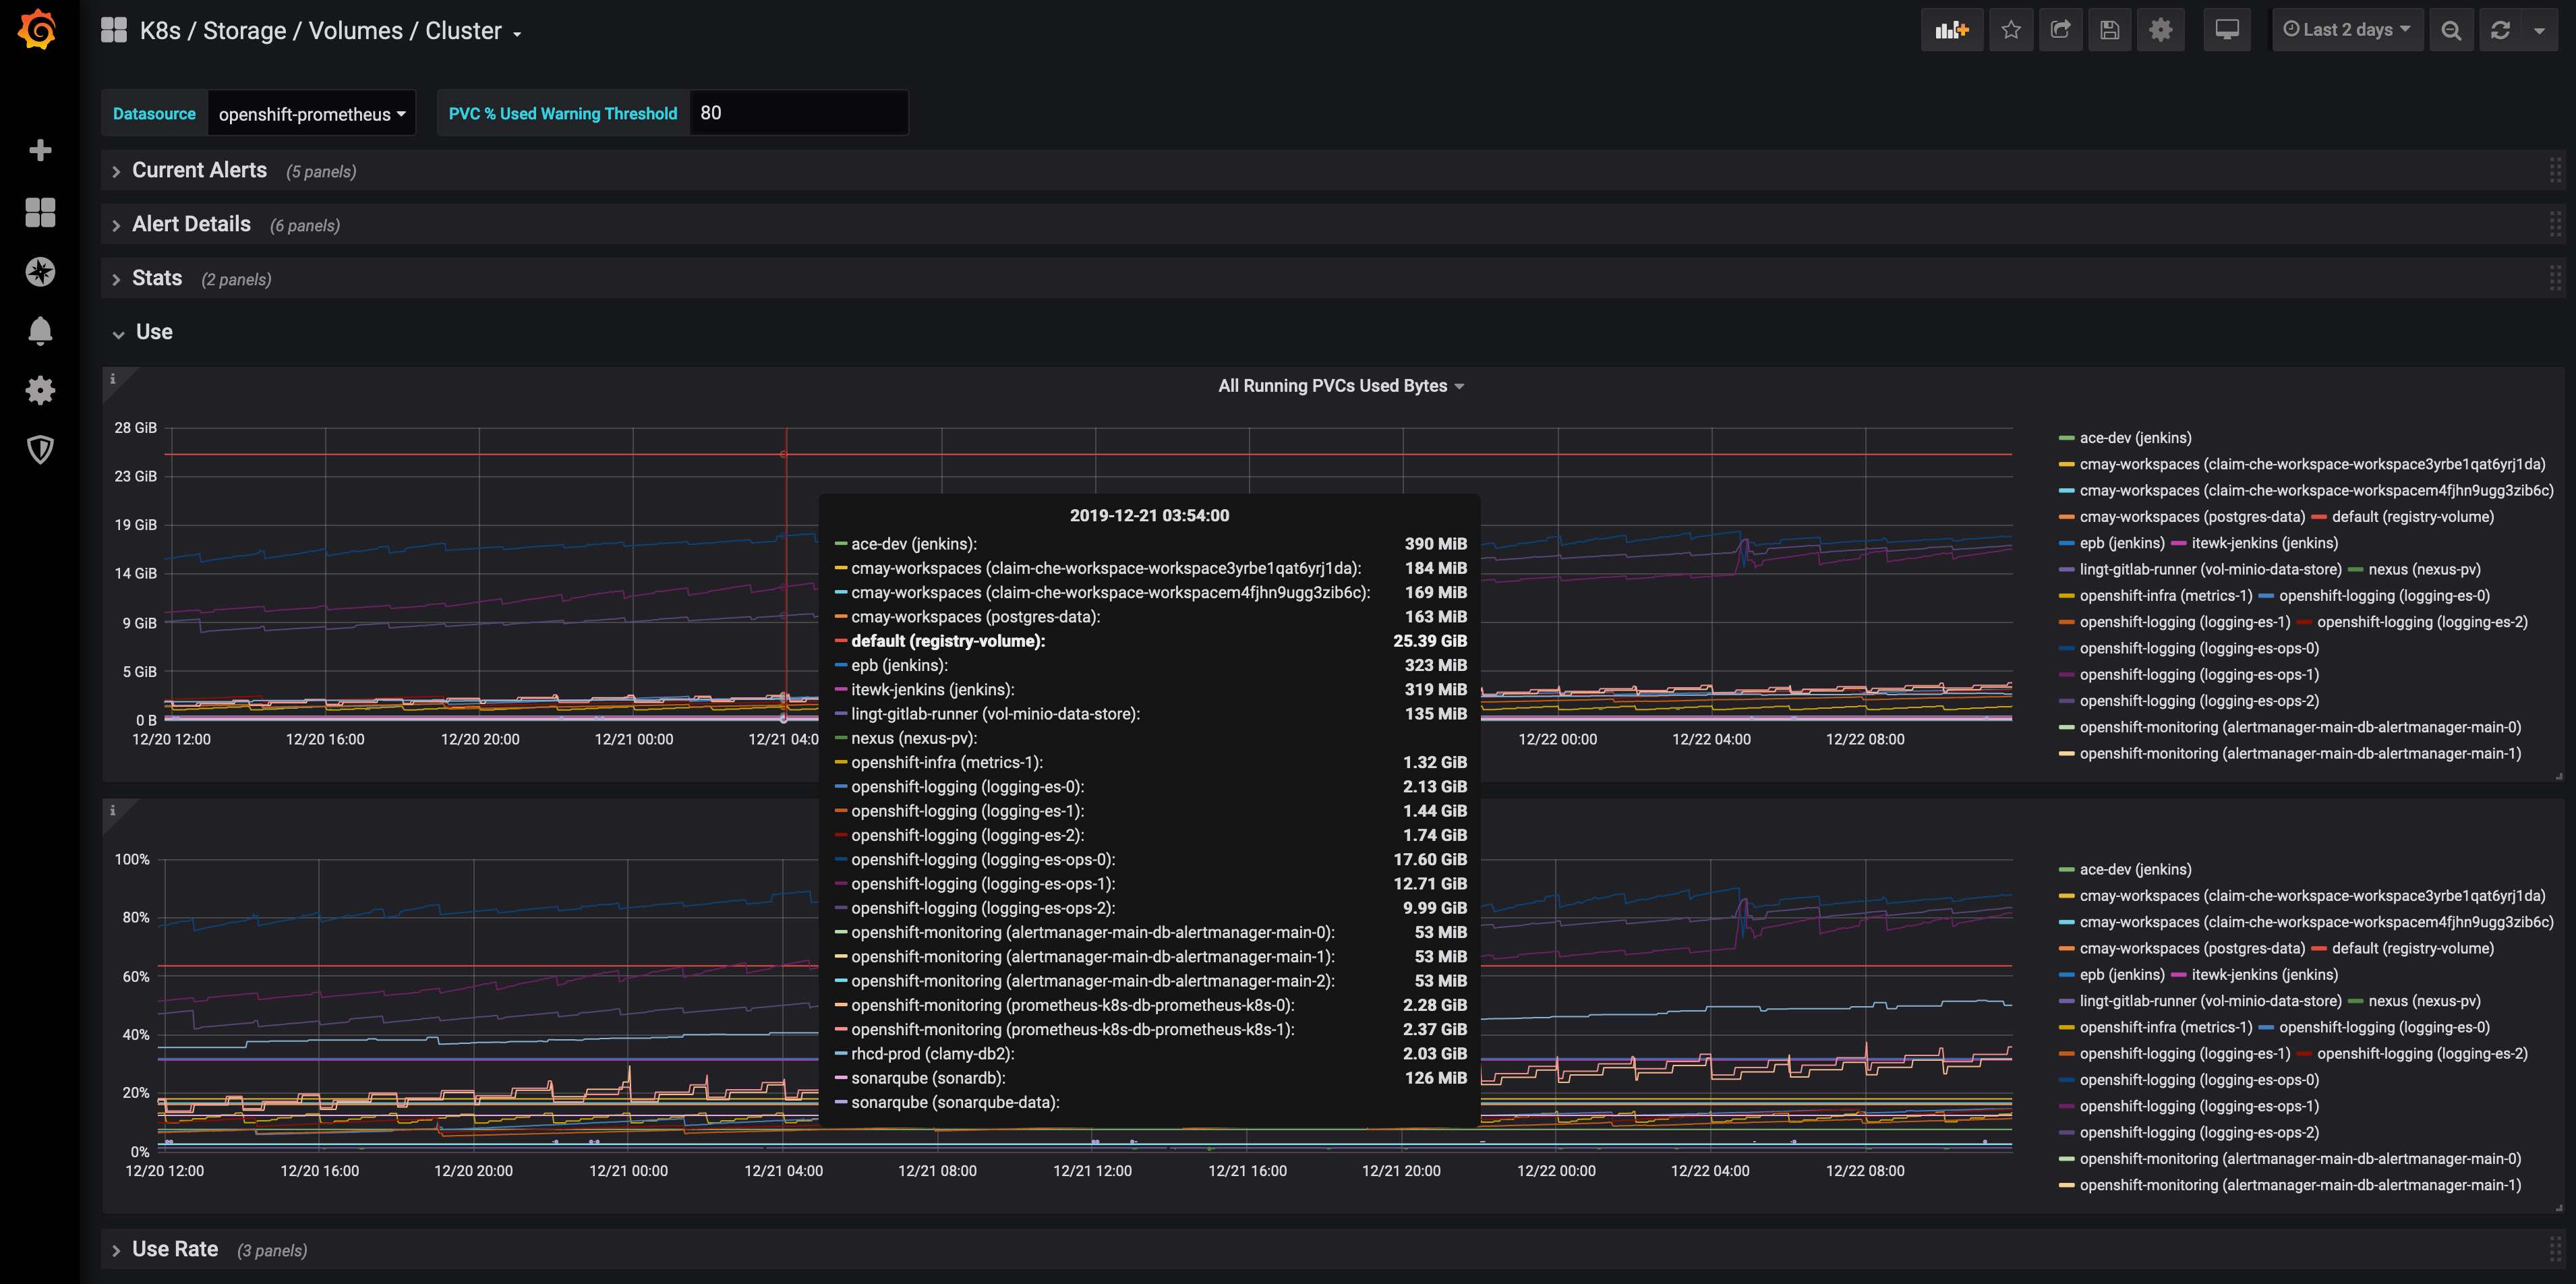
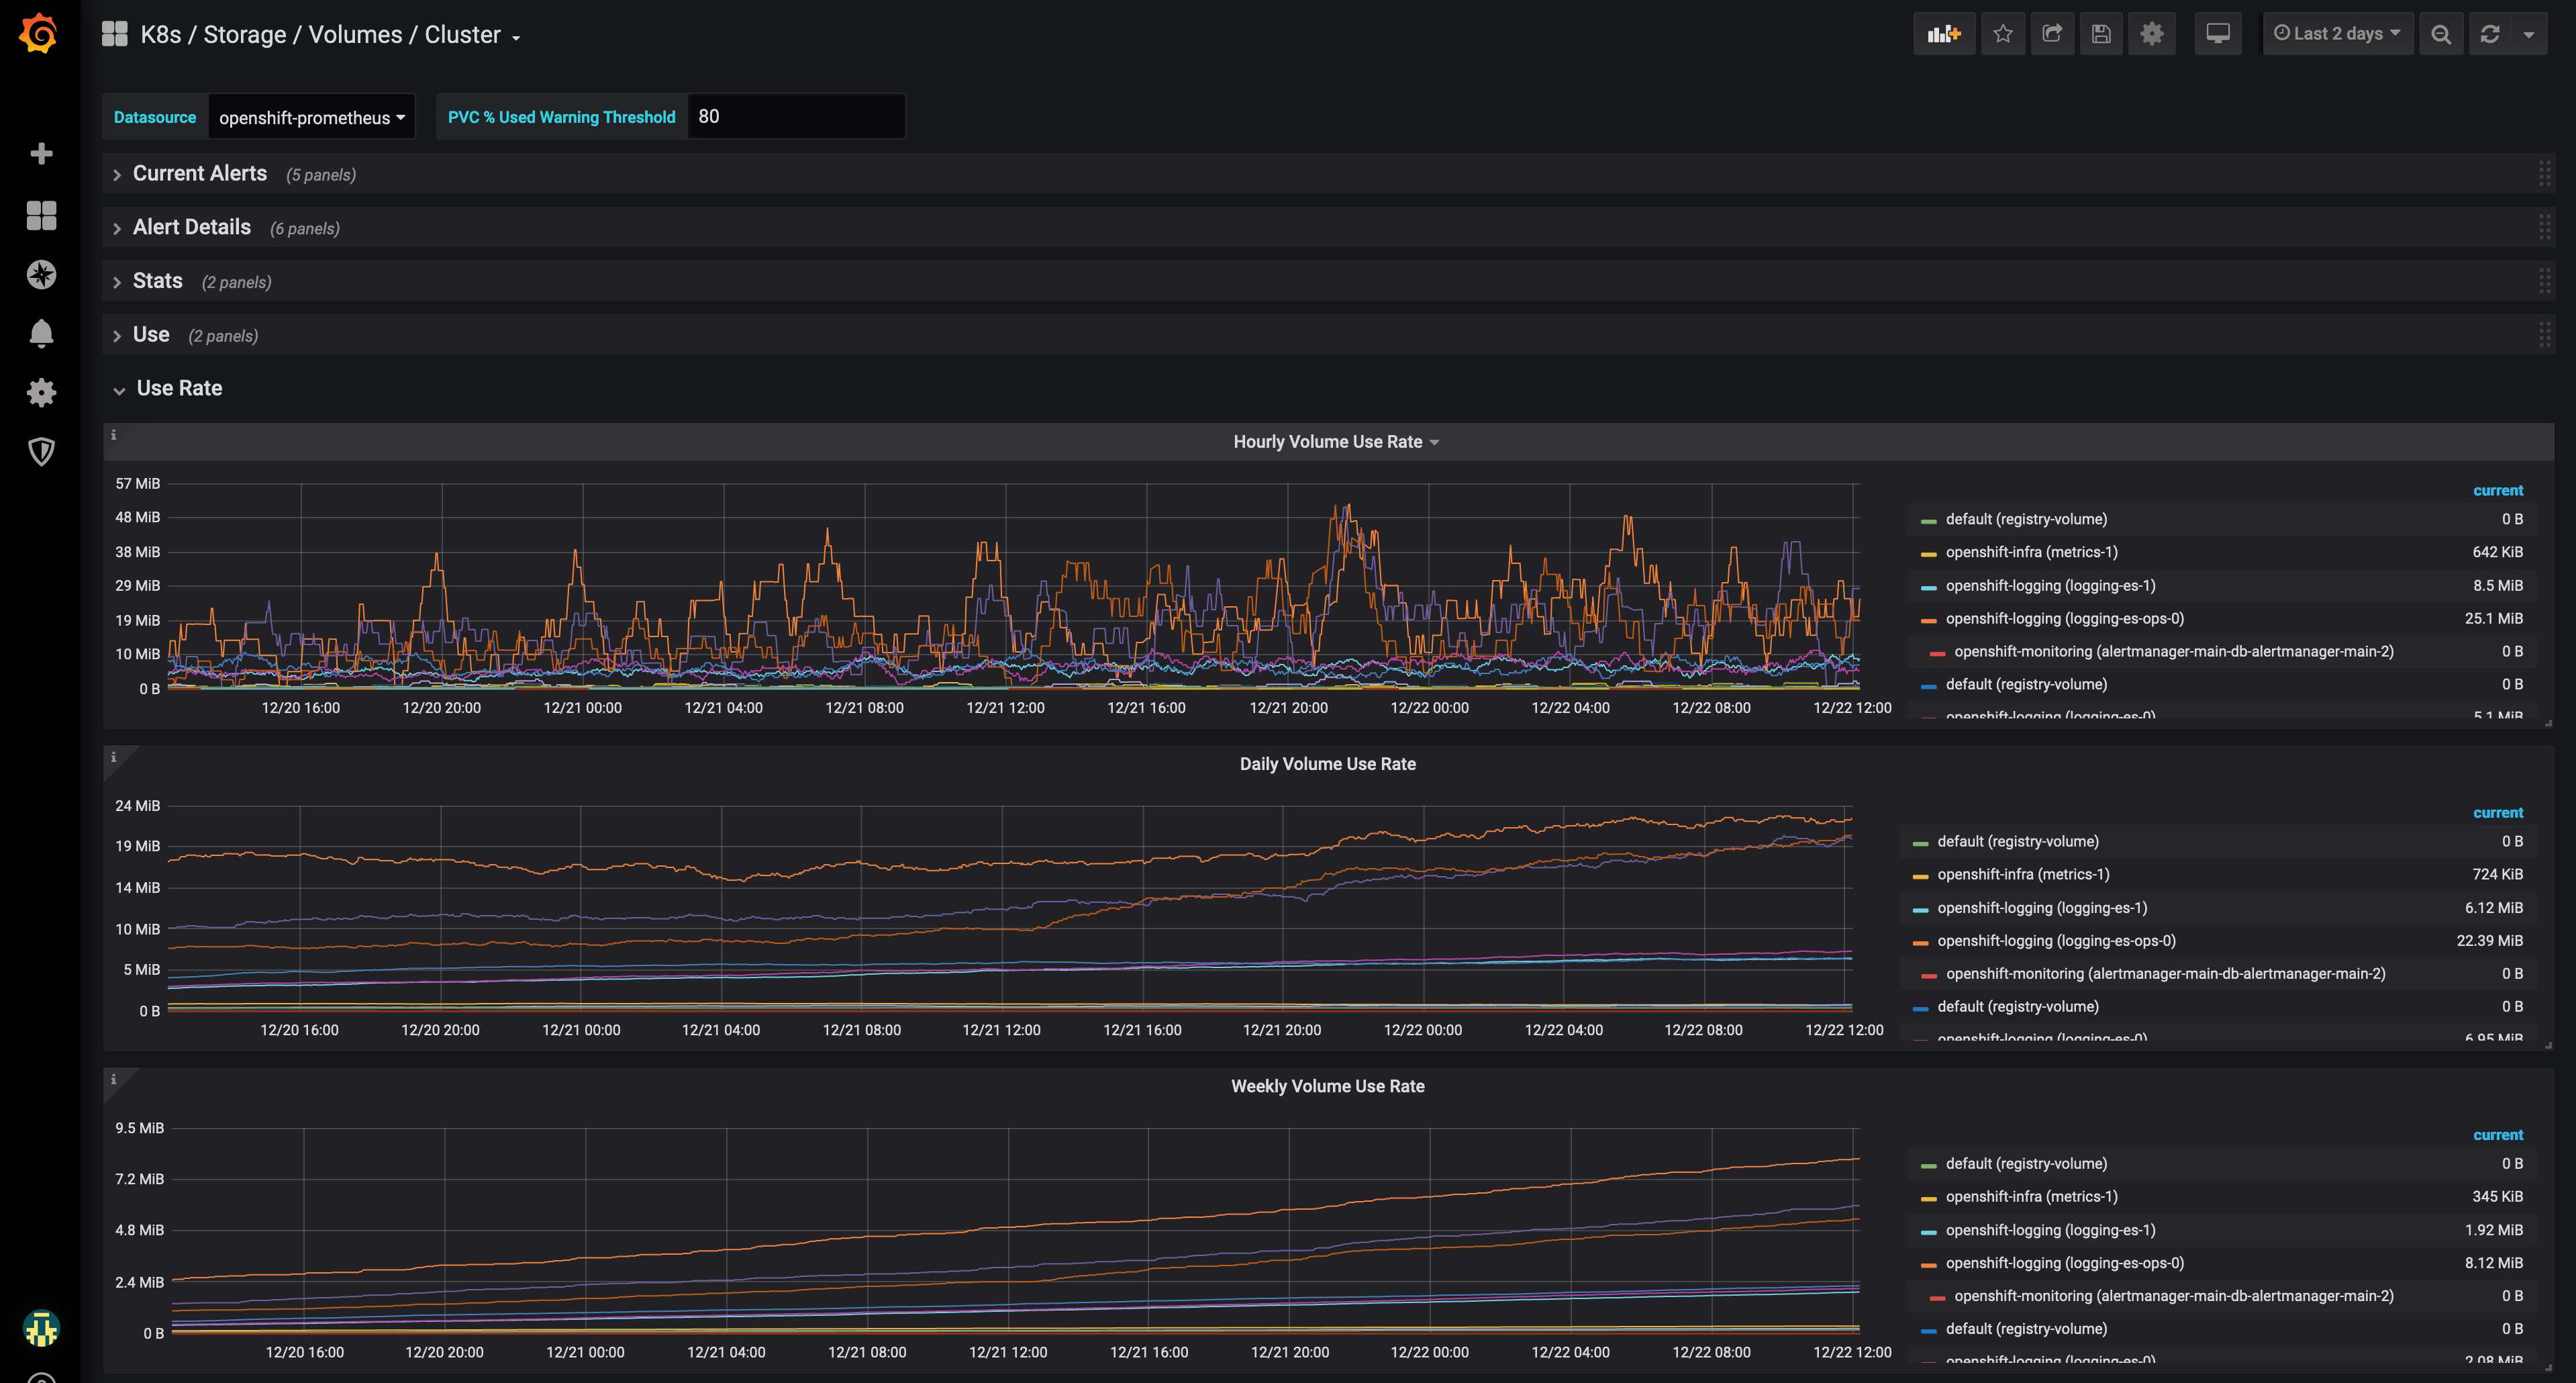
This dashboard monitors Kubernetes persistent volumes across namespaces, tracking capacity, usage, and availability to identify storage pressures and allocation gaps. It highlights per-namespace volume trends and weekly usage rates, with key metrics such as kubelet_volume_stats_used_bytes and kubelet_volume_stats_capacity_bytes to quantify consumption and remaining space, while alerts and unbound PVCs provide proactive risk indicators and remediation visibility.
Screenshots
Used Metrics 55
kubelet_volume_stats_available_bytes
kubelet_volume_stats_capacity_bytes
kubelet_volume_stats_used_bytes
pv_collector_unbound_pvc_count
pvc_percent_used_warning_threshold
Get Dashboard✕
Download
Copy to Clipboard