Kafka Exporter Overview 203,749203,749 3.0 (7 reviews)
8/20/2018
8/21/2018
5
>=5.1.1
Prometheus
Description
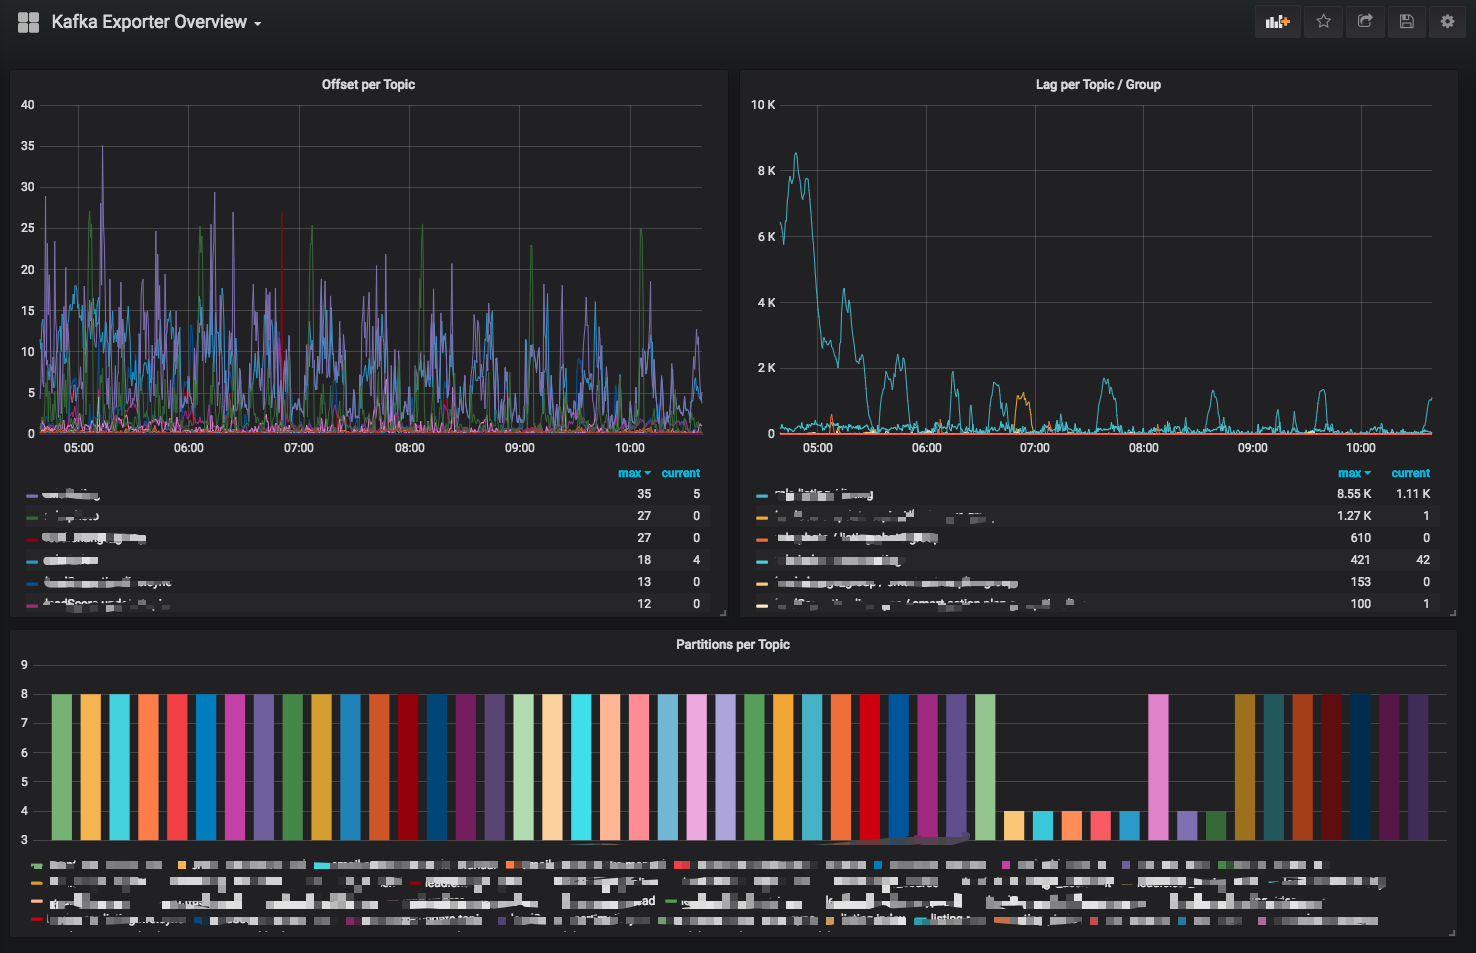
This dashboard monitors Kafka consumer throughput and lag metrics, providing a real-time view of consumption activity and partition distribution. Key panels highlight throughput with Message in per second and Message in per minute, lag behavior with kafka_consumergroup_lag, and partition topology via kafka_topic_partitions (with context on per-topic offsets through kafka_topic_partition_current_offset and consumer offsets via kafka_consumergroup_current_offset). It emphasizes per-topic and per-consumer-group perspectives to identify slow consumers, partition imbalances, and overall messaging throughput.
Screenshots
Get Dashboard✕
Download
Copy to Clipboard