Keycloak Metrics Dashboard 27,148,46227,148,462 2.5 (2 reviews)
Description
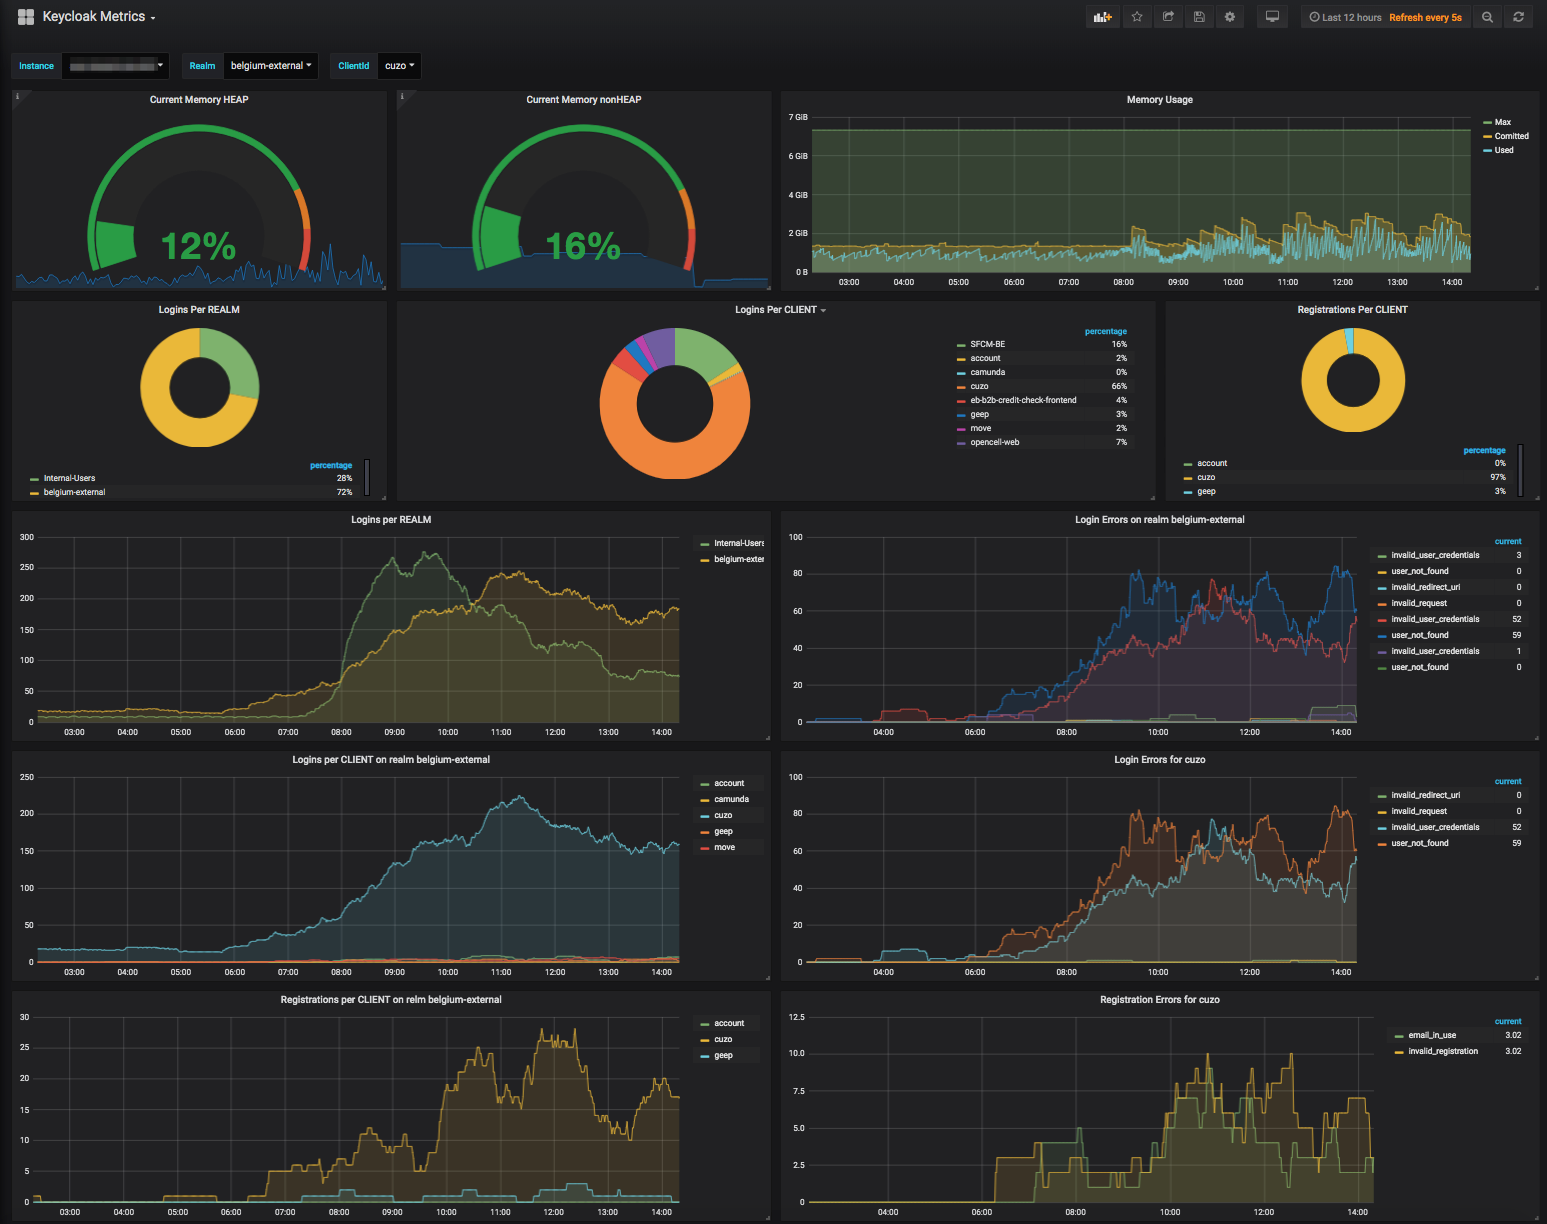
This dashboard provides a comprehensive view of Keycloak runtime health and authentication activity by exposing JVM memory usage alongside real-time authentication metrics. It combines per-realm and per-client login/registration activity with error rates, and high-resolution request latency distributions (GET/POST) to quickly identify performance bottlenecks and failedauth trends across tenants. Key features include heatmaps for duration, percentiles for fast responses, and per-realm/client drilldowns to correlate traffic with capacity and stability.
Screenshots
Used Metrics 1010
jvm_memory_bytes_committed
jvm_memory_bytes_max
jvm_memory_bytes_used
keycloak_failed_login_attempts
keycloak_logins
keycloak_registrations
keycloak_registrations_errors
keycloak_request_duration_bucket
keycloak_request_duration_count
keycloak_response_errors