Kubernetes Capacity 148,949148,949 5.0 (2 reviews)
Description
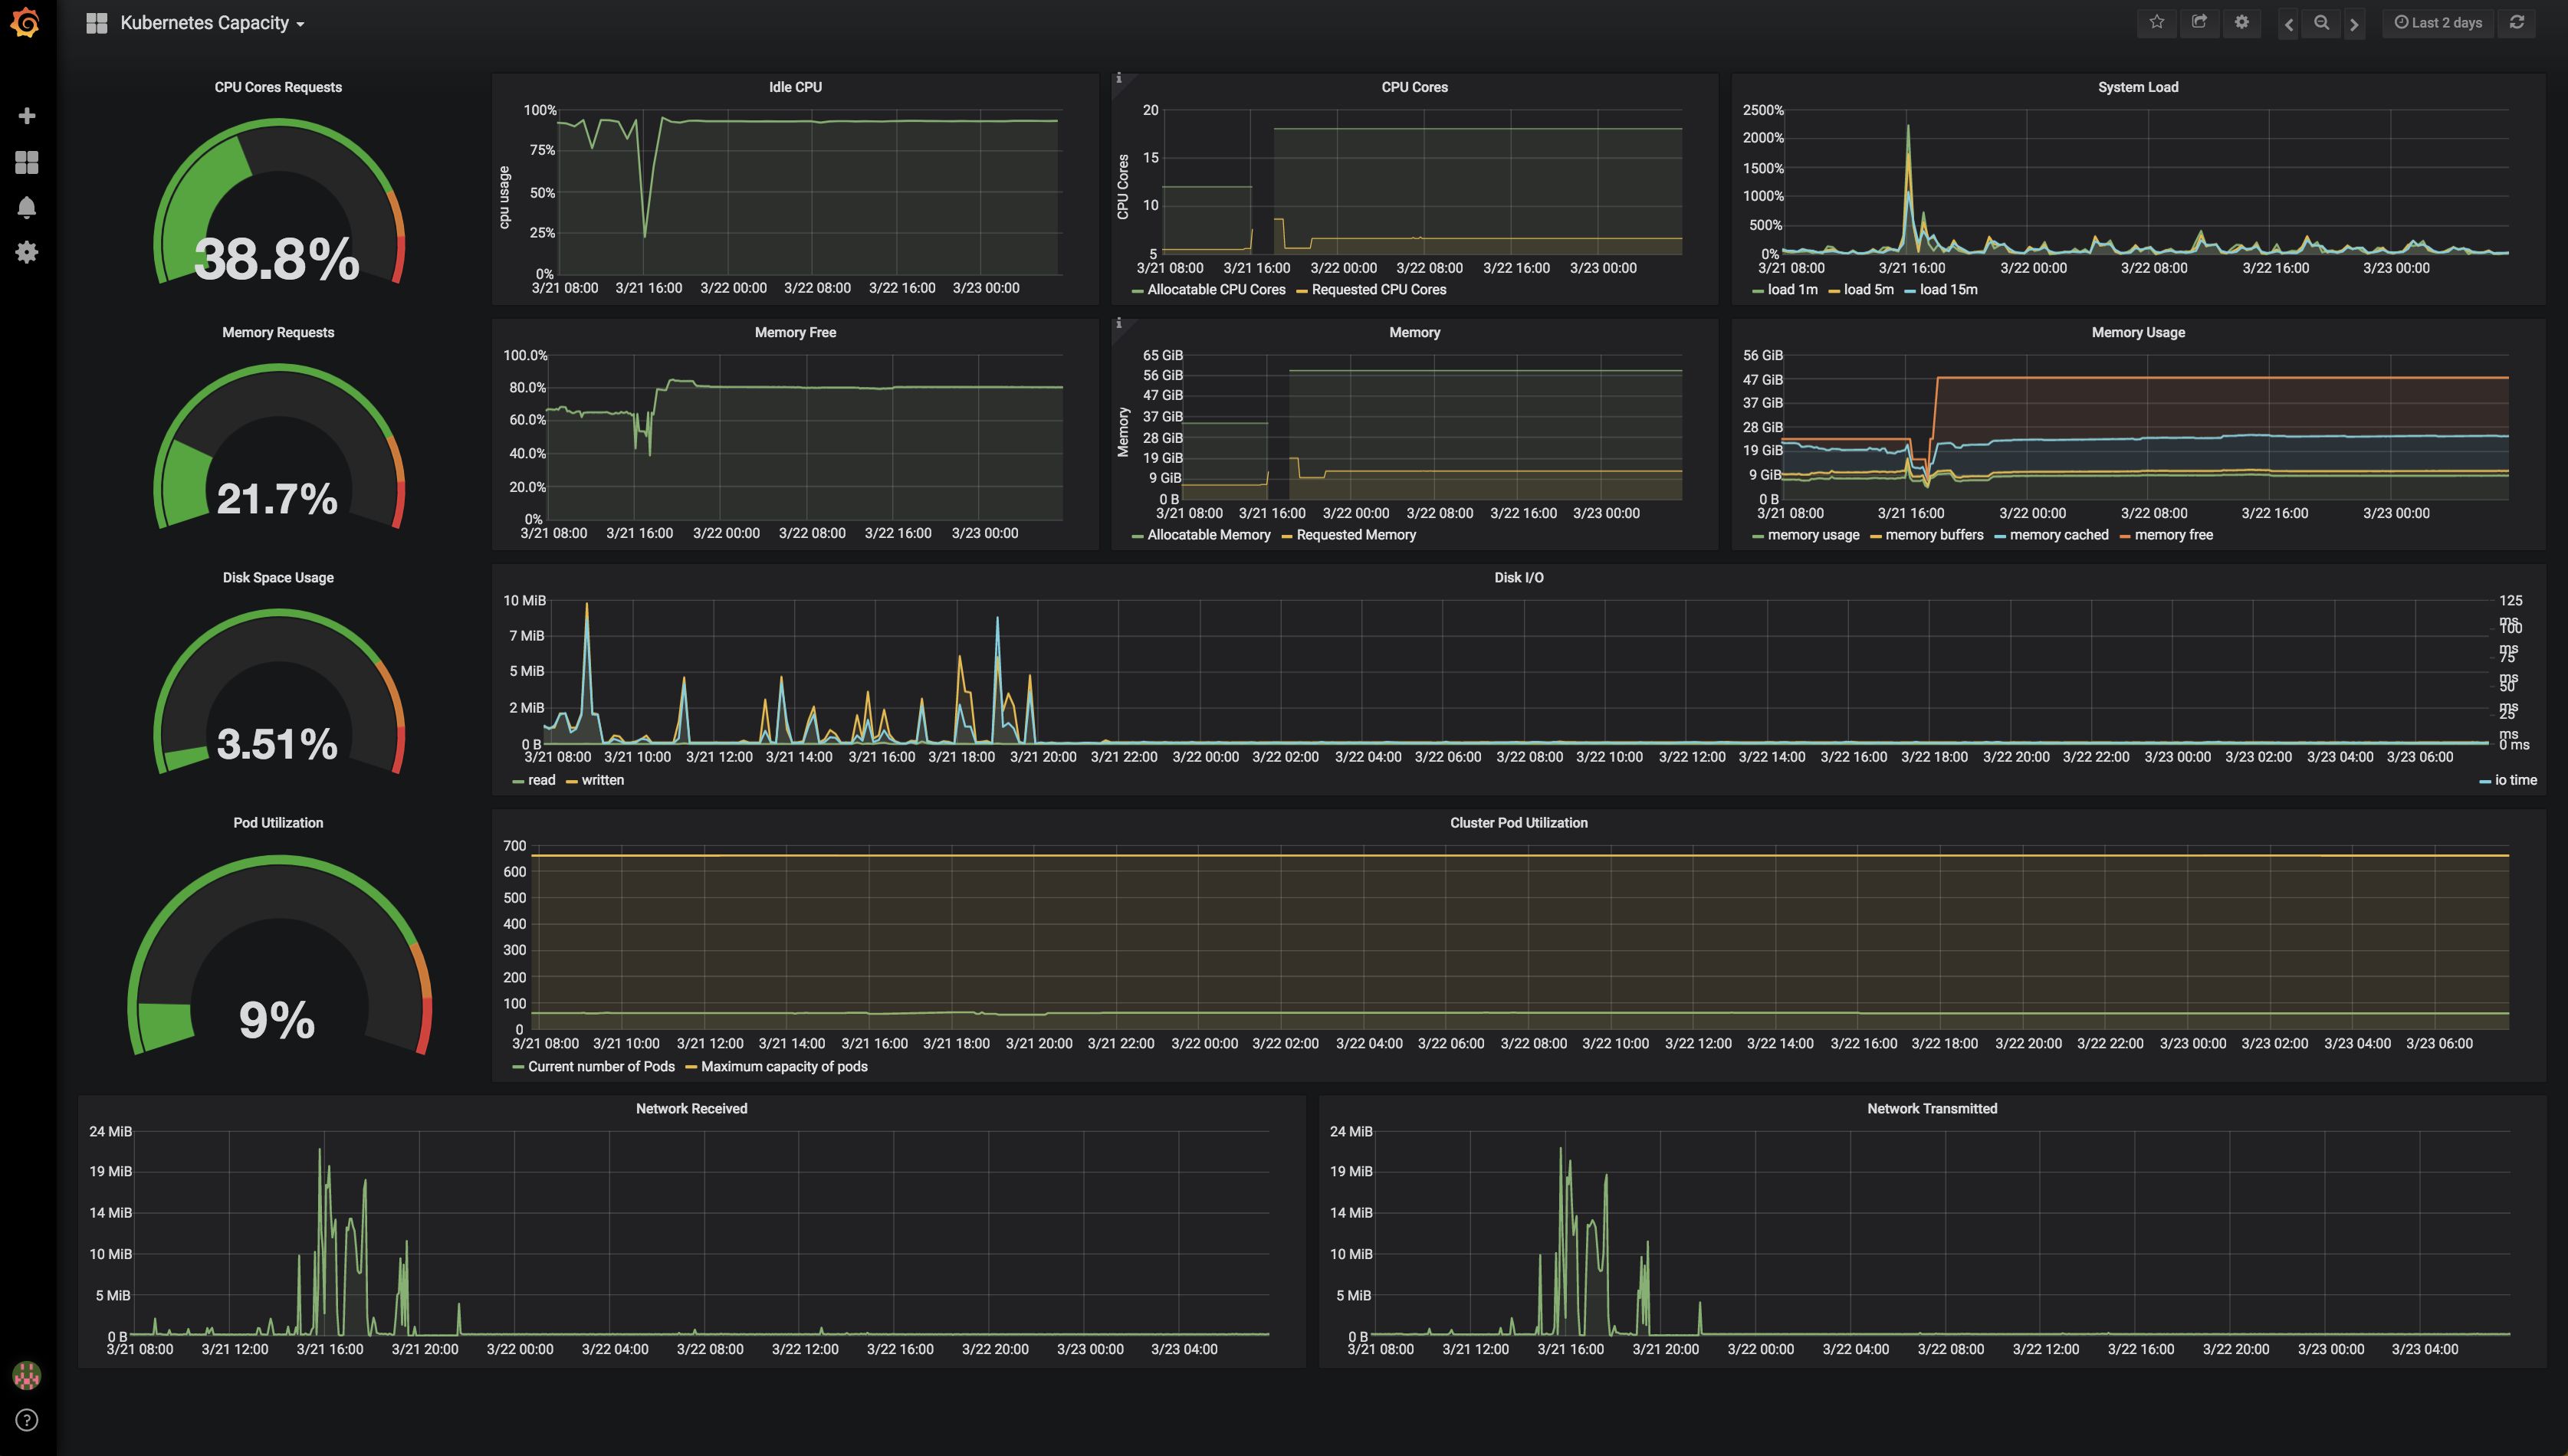
This dashboard monitors Kubernetes capacity by aggregating node and pod resource usage and availability, offering a snapshot of resource pressure and utilization across CPU, memory, disk, network, and pod schedules. It highlights cpu and memory resources, including metrics such as kube_node_status_allocatable_cpu_cores, node_cpu_seconds_total, and kube_pod_container_resource_requests_memory_bytes, alongside indicators like system load (node_load1, node_load5, node_load15) and disk space usage to reveal where capacity is constrained and where headroom exists.
Screenshots
Used Metrics 2626
kube_node_status_allocatable_cpu_cores
kube_node_status_allocatable_memory_bytes
kube_node_status_capacity_pods
kube_pod_container_resource_limits_memory_bytes
kube_pod_container_resource_requests_cpu_cores
kube_pod_container_resource_requests_memory_bytes
kube_pod_info
-
node_cpu_seconds_total
-
node_disk_io_time_seconds_total
-
node_disk_read_bytes_total
-
node_disk_written_bytes_total
-
node_filesystem_free_bytes
-
node_filesystem_size_bytes
-
node_load1
-
node_load15
-
node_load5
node_memory_Buffers
-
node_memory_Buffers_bytes
node_memory_Cached
-
node_memory_Cached_bytes
node_memory_MemFree
-
node_memory_MemFree_bytes
node_memory_MemTotal
-
node_memory_MemTotal_bytes
-
node_network_receive_bytes_total
-
node_network_transmit_bytes_total