Kubernetes / Capacity Planning / Limits 325,084325,084
10/8/2020
6/22/2021
2
>=7.5.7
Prometheus
Description
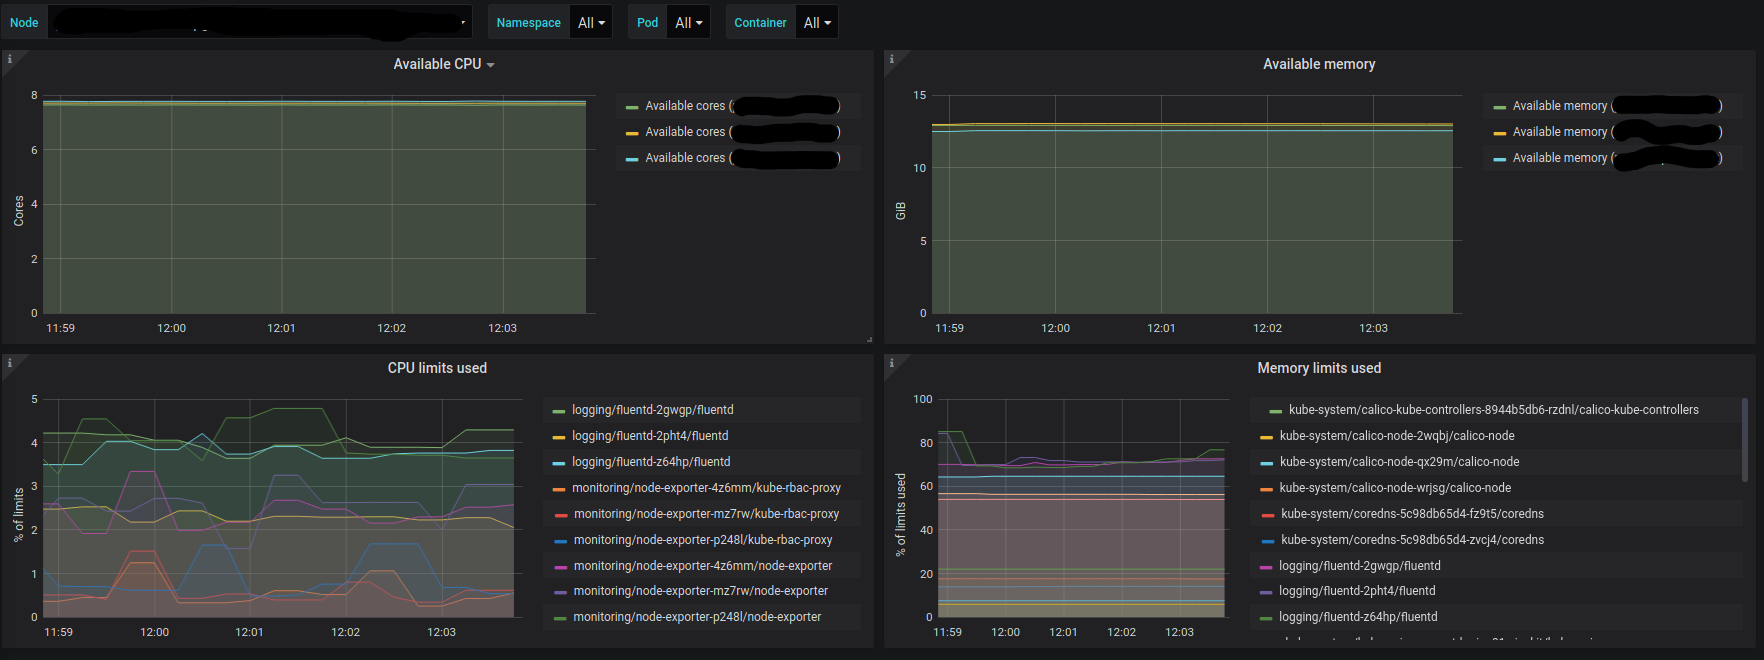
This dashboard provides a capacity view for Kubernetes by tracking resource limits and availability to help plan scaling and prevent saturation. It highlights key metrics such as node_cpu_seconds_total, container_cpu_usage_seconds_total, and node_memory_MemAvailable_bytes to show CPU usage, CPU quota adherence, and free memory, while panels like Available CPU, CPU limits used, Available memory, and Memory limits used surface how much headroom remains vs. defined limits.
Screenshots
Used Metrics 66
-
container_cpu_usage_seconds_total
-
container_memory_working_set_bytes
-
container_spec_cpu_quota
container_spec_memory_limit_bytes
-
node_cpu_seconds_total
-
node_memory_MemAvailable_bytes
Get Dashboard✕
Download
Copy to Clipboard